By: Mark Lacey & Alexander Monk
Soaring gas and electricity prices are here to stay this winter, and highlight the need for increased investment in energy transition technologies.
Rising gas and electricity prices have been hitting the headlines in recent weeks. Europe appears to be the centre of the storm, although it’s certainly not alone in seeing sharp price increases. China is also suffering energy shortages and is rationing power in some provinces as a result.
Many of the supply and demand drivers behind the price rises are also global in nature. However, there are some Europe-specific factors that could serve to keep prices high and there is no easy fix to bring prices back down rapidly.
Power prices soaring
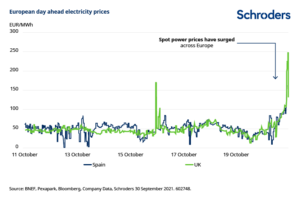
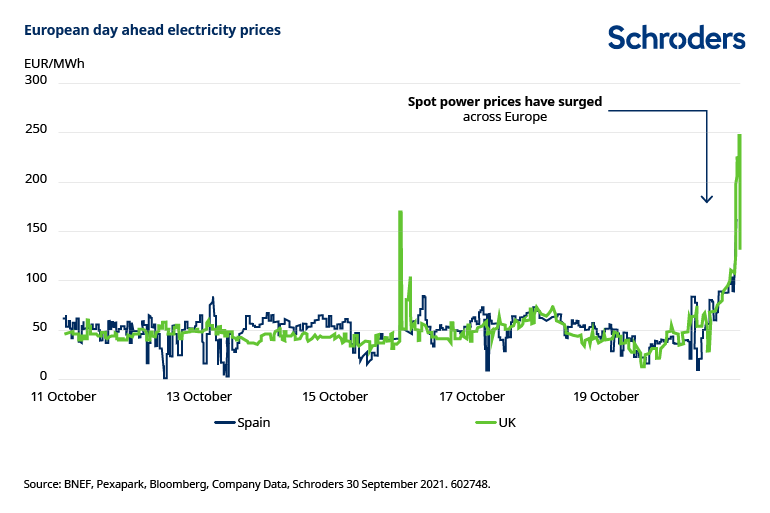
Firstly, as the chart below shows, power prices have jumped sharply in Europe in recent weeks. Most of this price surge is to do with shortages of natural gas.
Natural gas has long been seen as a “transitional” fuel for power generation. Compared to coal, it produces the same energy but with half the CO2 emissions. It’s by no means a long-term solution if we’re going to reach net zero emissions targets (unless carbon capture technology can be applied) but it’s a useful stopgap while coal is phased out.
However, partly as a result of its doubtful long-term future, there has been underinvestment in natural gas. Many integrated oil & gas companies have been reluctant to sanction new projects given that their wider aim is to transition towards renewable energy.
Meanwhile, low regional gas prices in previous years caused various LNG (liquified natural gas) export projects to be stopped or deferred. Projects that would have been providing supply in 2019, 2020 and 2021 are now only likely to supply global gas markets in 2025 and beyond.
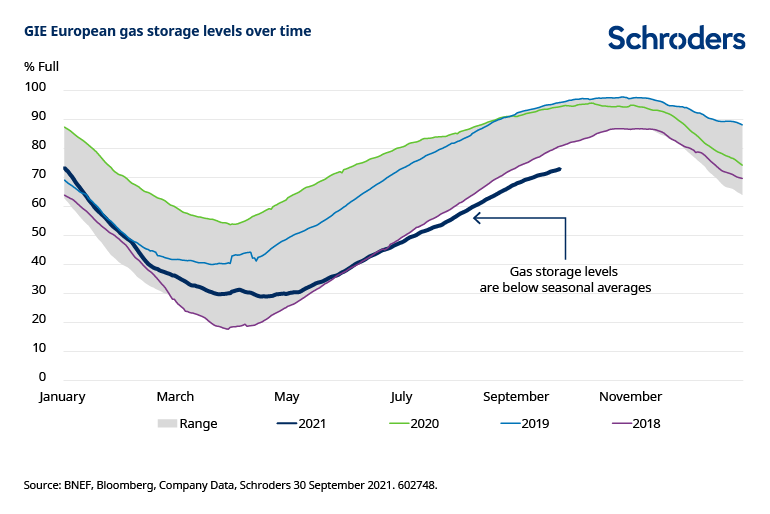
At the same time, gas in storage is low globally. The chart below indicates how gas storage levels in Europe are far below the norm as we head into the colder winter months.

Lack of wind denting renewable output
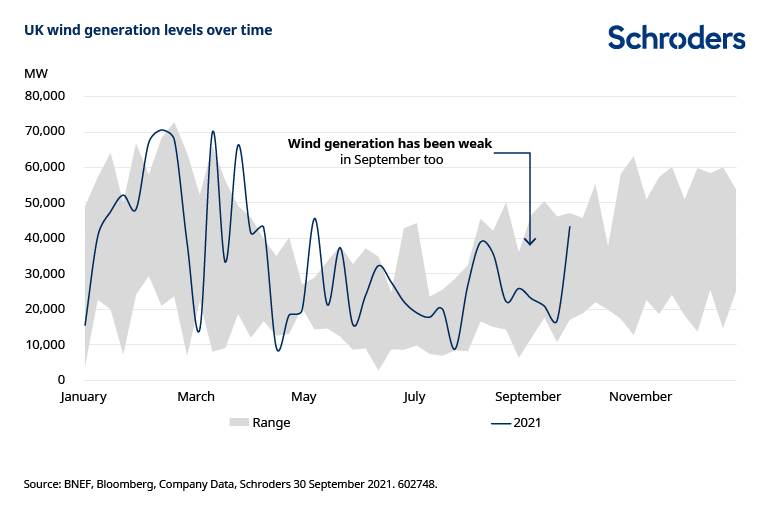
That shortfall in gas availability is now coinciding with an increase in demand. Recent coal-fired shut ins and unfavourable weather are impacting other sources of power generation. The chart below shows how wind speeds in the UK have been far lower than usual over much of the summer and into September, negatively affecting wind power generation.

The current situation is not an argument against the ability of renewable energy to supply our power needs; it merely highlights how the investment rates in the energy transition space need to increase.
If countries are going to meet their ambitious 2030 targets to reduce harmful emissions, they will need to up investment levels. In turn, this will provide much needed flexibility in global power markets.
No easy answers
However, that will take some time and there is no quick fix to overcome the gas shortage right now. The Groningen gas field in the Netherlands, once Europe’s biggest gas producer, has reduced production dramatically over the past decade due to earthquake risk from drilling.
Europe is therefore very reliant on Russia for gas supply but Russian storage levels were depleted along with the rest of the world. Volumes are still recovering after a fire at the Novy Urengoy plant in August and Russia is still waiting for Europe to approve the Nordstream 2 pipeline. We think it unlikely that gas volumes from Nordstream 2 will be hitting the European market before the end of this year.
Added to that, it is unlikely that wind power can come to the rescue right away and help bring overall power prices down. The chart below shows how wind power typically accounts for a large proportion of Europe’s electricity demand in Q4, but that there could be a shortfall again in Q1.
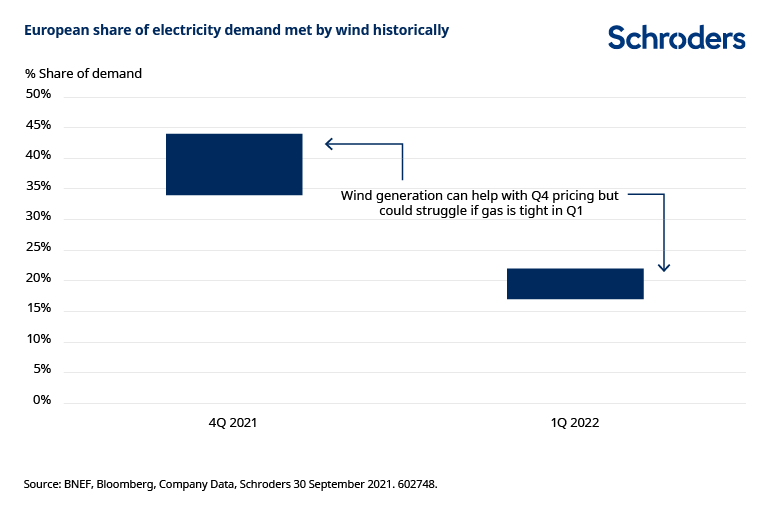

We therefore don’t anticipate the current tight situation in European power markets will ease until around June next year.
And of course, electricity cannot simply substitute for gas. The UK, for example is reliant on gas for almost all of its heating needs.
What does this mean for investors?
In the near term, the rising gas price is clearly good for energy companies with gas exposure who will benefit from growing cash flows over the next few quarters.
A note of caution is warranted though, because there is no guarantee that customers will simply pay ever-higher prices. If supply can’t keep up then demand may fall. We have already seen in the UK how rising gas prices caused some fertiliser firms to shut down production, with a knock-on impact to the food industry.
With the higher gas price also sending electricity prices higher, we are starting to see an increase in the pricing of power purchase agreements (PPAs) in both the US and Europe. These are long-term electricity supply agreements between power producers and a customer. This is positive for the developers of new power projects who are currently able to more than offset rising equipment costs by achieving higher PPA prices.
On a longer-term view, the tight power market should be supportive in terms of speeding up investment rates in the energy transition. More renewable power generation and storage is clearly needed.
Taking a broader view, however, these power price rises are feeding into an environment that was already seeing pockets of inflation and supply chain disruption. Businesses and consumers will ultimately bear the brunt of the price rises and that is likely to have an impact on the economy more widely.
Investors will need to tread carefully, not just in the energy or energy transition sectors but in the wider equity market too.
—
Originally Posted on October 14, 2021 – Four Charts That Explain Europe’s Power Price Surge
The views and opinions contained herein are those of Schroders’ investment teams and/or Economics Group, and do not necessarily represent Schroder Investment Management North America Inc.’s house views. These views are subject to change. This information is intended to be for information purposes only and it is not intended as promotional material in any respect.
Disclosure: Schroders
Important Information: This communication is marketing material. The views and opinions contained herein are those of the author(s) on this page, and may not necessarily represent views expressed or reflected in other Schroders communications, strategies or funds. This material is intended to be for information purposes only and is not intended as promotional material in any respect. The material is not intended as an offer or solicitation for the purchase or sale of any financial instrument. It is not intended to provide and should not be relied on for accounting, legal or tax advice, or investment recommendations. Reliance should not be placed on the views and information in this document when taking individual investment and/or strategic decisions. Past performance is not a reliable indicator of future results. The value of an investment can go down as well as up and is not guaranteed. All investments involve risks including the risk of possible loss of principal. Information herein is believed to be reliable but Schroders does not warrant its completeness or accuracy. Some information quoted was obtained from external sources we consider to be reliable. No responsibility can be accepted for errors of fact obtained from third parties, and this data may change with market conditions. This does not exclude any duty or liability that Schroders has to its customers under any regulatory system. Regions/ sectors shown for illustrative purposes only and should not be viewed as a recommendation to buy/sell. The opinions in this material include some forecasted views. We believe we are basing our expectations and beliefs on reasonable assumptions within the bounds of what we currently know. However, there is no guarantee than any forecasts or opinions will be realized. These views and opinions may change. Schroder Investment Management North America Inc. is a SEC registered adviser and indirect wholly owned subsidiary of Schroders plc providing asset management products and services to clients in the US and Canada. Interactive Brokers and Schroders are not affiliated entities. Further information about Schroders can be found at www.schroders.com/us. Schroder Investment Management North America Inc. 7 Bryant Park, New York, NY, 10018-3706, (212) 641-3800.
Disclosure: Interactive Brokers
Information posted on IBKR Campus that is provided by third-parties does NOT constitute a recommendation that you should contract for the services of that third party. Third-party participants who contribute to IBKR Campus are independent of Interactive Brokers and Interactive Brokers does not make any representations or warranties concerning the services offered, their past or future performance, or the accuracy of the information provided by the third party. Past performance is no guarantee of future results.
This material is from Schroders and is being posted with its permission. The views expressed in this material are solely those of the author and/or Schroders and Interactive Brokers is not endorsing or recommending any investment or trading discussed in the material. This material is not and should not be construed as an offer to buy or sell any security. It should not be construed as research or investment advice or a recommendation to buy, sell or hold any security or commodity. This material does not and is not intended to take into account the particular financial conditions, investment objectives or requirements of individual customers. Before acting on this material, you should consider whether it is suitable for your particular circumstances and, as necessary, seek professional advice.
Disclosure: Futures Trading
Futures are not suitable for all investors. The amount you may lose may be greater than your initial investment. Before trading futures, please read the CFTC Risk Disclosure. A copy and additional information are available at ibkr.com.


