


By: Maxwell Gold, CFAHead of Gold Strategy
This post was written with contributions from the SPDR Gold Strategy Team: George Milling-Stanley, Chief Gold Strategist, and Diego Andrade, Senior Gold Strategist.
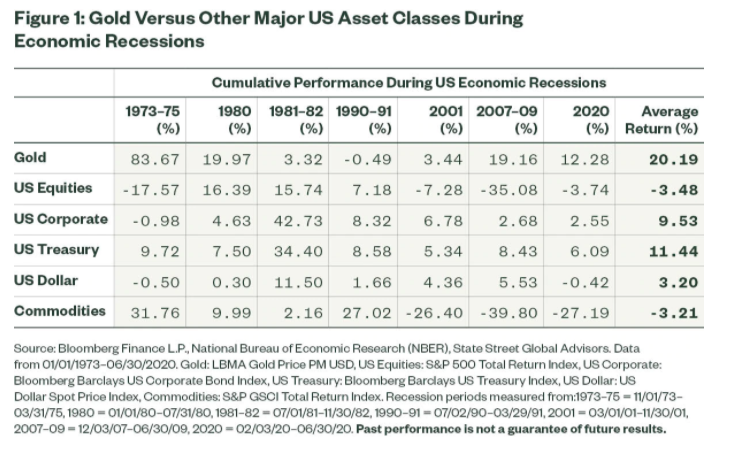
- Gold has historically performed better than US stocks, bonds, and the dollar have during recessions for approximately the past 50 years. See Figure 1 below.
- As the US economy continues on its path toward recovery, gold shows signs of remaining strong and may play a key role in managing portfolios through ongoing uncertainty.
- A US recovery boding persistent low rates and accommodative policies will likely continue to benefit gold.
With GDP posting a record low of -31.7% for Q2 2020,1 the United States officially entered its first economic recession in over a decade. Gold is popularly associated with providing a potential hedge during economic downturns, so it’s not much of a surprise that it has risen 27% year to date and is on track to have its best year since 2010.2 Given continued uncertainty during this current recession, it may pay to not only focus on gold’s historical track record during these phases, but also to evaluate the key drivers supporting gold’s current outlook,3 which remain strong – even against the potential for a US economic recovery.
Gold Leads in the Recession Procession
The investing merit of gold during recessions is a common association, and as Figure 1 highlights, this is well earned. Since 1971, when gold began freely trading in the post-Bretton Woods era, the US has experienced seven economic recessions. During these periods, gold averaged a 20.19% return, which has led the way compared with other major US assets – including US stocks, Treasury bonds, corporate bonds, and the US dollar. Additionally, gold managed to provide positive returns and outperform broad commodities in all but one of those periods (1990-1991).
Click Here to Read the Full Article
Footnotes
1 Bloomberg Finance L.P, Bureau of Economic Analysis. Data as of 6/30/2020.
2 Bloomberg Finance L.P., State Street Global Advisors. Year-to-date return as of 8/27/2020. Gold price return was 29.6% in 2010.
3 https://www.ssga.com/etfs/insights/gold-nuggets-the-midyear-outlook
4 As measured by Conference Board LEI Index. Four phases of business cycle (recession, recovery, expansion, slowdown) were measured based on the direction and magnitude of changes of the Conference Board Leading Economic Indicator (LEI) Index. Recession: LEI Index declines to a trough at an accelerating pace; Recovery: LEI Index rebounds from a trough but below long-term trends; Expansion: LEI Index YoY changes are positive and above long-term trends; Slowdown: LEI Index YoY changes pass the peak and begin moderating.
5 https://www.ssga.com/etfs/insights/gold-can-shine-in-a-dismal-dollar-environment
Glossary
Bloomberg Barclays US Corporate Bond Index
The Bloomberg Barclays US Corporate Bond Index measures the investment grade, fixed-rate, taxable corporate bond market.
Bloomberg Barclays US Treasury Index
The Bloomberg Barclays US Treasury Index measures US dollar-denominated, fixed-rate, nominal debt issued by the US Treasury.
Bretton Woods Agreement
An agreement in 1944 that established a gold exchange standard for Western European nations and Japan once World War II was over. Under the pact, respective currencies were pegged to the US dollar and central banks could exchange dollar holdings into gold at the official exchange rate of $35 per ounce. In 1971, US President Richard Nixon terminated convertibility of the US dollar into gold, which marked the beginning of the floating fiat currency structure that remains in place today. The agreement is so named because it was negotiated in Bretton Woods, New Hampshire.
Gross Domestic Product or GDP
The monetary value of all the finished goods and services produced within a country’s borders in a specific time period.
Leading Economic Indicators (LEI)
Leading indicators include economic variables that tend to move before changes in the overall economy. These indicators give a sense of the future state of an economy.
Recession
A contraction in economic activity as profits decline and consumer expectations begin to bottom out that typically leads to accommodative monetary policy. Recessions have been characterized as at least two consecutive quarters of economic contraction, but definitions vary, and the concept is subjective.
S&P GSCI Total Return Index
The S&P GSCI Total Return Index in USD is widely recognized as the leading measure of general commodity price movements and inflation in the world economy. Index is calculated primarily on a world production weighted basis comprised of the principal physical commodities futures contracts.
S&P 500 Total Return Index
The S&P 500® is widely regarded as the best single gauge of large-cap U.S. equities and serves as the foundation for a wide range of investment products. The index includes 500 leading companies and captures approximately 80% coverage of available market capitalization.
US Dollar Index
The US Dollar Index (DXY) measures the performance of the US Dollar against a basket of currencies: the euro (EUR), the Japanese yen (JPY), the British pound sterling (GBP), the Canadian dollar (CAD), the Swiss Franc (CHF) and the Swedish krona (SEK).
—
Originally Posted on September 10, 2020 – Gold & Recessions: What to Know This Time Around
Disclosure
Commodity funds may be subject to greater volatility than investments in traditional securities. Investments in commodities may be affected by overall market movements, changes in interest rates, and other factors, such as weather, disease, embargoes, and international economic and political developments.
This material is for your private information. The views expressed are the views the SPDR® Gold Strategy Team and are subject to change based on market and other conditions. The opinions expressed may differ from those with different investment philosophies.
Disclosure: State Street Global Advisors
Do not reproduce or reprint without the written permission of SSGA.
All information has been obtained from sources believed to be reliable, but its accuracy is not guaranteed. There is no representation or warranty as to the current accuracy, reliability or completeness of, nor liability for, decisions based on such information and it should not be relied on as such.
State Street Global Advisors and its affiliates (“SSGA”) have not taken into consideration the circumstances of any particular investor in producing this material and are not making an investment recommendation or acting in fiduciary capacity in connection with the provision of the information contained herein.
ETFs trade like stocks, are subject to investment risk, fluctuate in market value and may trade at prices above or below the ETF’s net asset value. Brokerage commissions and ETF expenses will reduce returns.
Bonds generally present less short-term risk and volatility than stocks, but contain interest rate risk (as interest rates raise, bond prices usually fall); issuer default risk; issuer credit risk; liquidity risk; and inflation risk. These effects are usually pronounced for longer-term securities. Any fixed income security sold or redeemed prior to maturity may be subject to a substantial gain or loss.
Investing involves risk including the risk of loss of principal.
The whole or any part of this work may not be reproduced, copied or transmitted or any of its contents disclosed to third parties without SSGA’s express written consent.
Investing in high yield fixed income securities, otherwise known as “junk bonds”, is considered speculative and involves greater risk of loss of principal and interest than investing in investment grade fixed income securities. These Lower-quality debt securities involve greater risk of default or price changes due to potential changes in the credit quality of the issuer.
COPYRIGHT AND OTHER RIGHTS
Other third party content is the intellectual property of the respective third party and all rights are reserved to them. All rights reserved. No organization or individual is permitted to reproduce, distribute or otherwise use the statistics and information in this report without the written agreement of the copyright owners.
Definition:
Arbitrage: the simultaneous buying and selling of securities, currency, or commodities in different markets or in derivative forms in order to take advantage of differing prices for the same asset.
Fund Objectives:
SPY: The investment seeks to provide investment results that, before expenses, correspond generally to the price and yield performance of the S&P 500® Index. The Trust seeks to achieve its investment objective by holding a portfolio of the common stocks that are included in the index (the “Portfolio”), with the weight of each stock in the Portfolio substantially corresponding to the weight of such stock in the index.
VOO: The investment seeks to track the performance of a benchmark index that measures the investment return of large-capitalization stocks. The fund employs an indexing investment approach designed to track the performance of the Standard & Poor’s 500 Index, a widely recognized benchmark of U.S. stock market performance that is dominated by the stocks of large U.S. companies. The advisor attempts to replicate the target index by investing all, or substantially all, of its assets in the stocks that make up the index, holding each stock in approximately the same proportion as its weighting in the index.
IVV: The investment seeks to track the investment results of the S&P 500 (the “underlying index”), which measures the performance of the large-capitalization sector of the U.S. equity market. The fund generally invests at least 90% of its assets in securities of the underlying index and in depositary receipts representing securities of the underlying index. It may invest the remainder of its assets in certain futures, options and swap contracts, cash and cash equivalents, as well as in securities not included in the underlying index, but which the advisor believes will help the fund track the underlying index.
The funds presented herein have different investment objectives, costs and expenses. Each fund is managed by a different investment firm, and the performance of each fund will necessarily depend on the ability of their respective managers to select portfolio investments. These differences, among others, may result in significant disparity in the funds’ portfolio assets and performance. For further information on the funds, please review their respective prospectuses.
Entity Disclosures:
The trademarks and service marks referenced herein are the property of their respective owners. Third party data providers make no warranties or representations of any kind relating to the accuracy, completeness or timeliness of the data and have no liability for damages of any kind relating to the use of such data.
SSGA Funds Management, Inc. serves as the investment advisor to the SPDR ETFs that are registered with the United States Securities and Exchange Commission under the Investment Company Act of 1940. SSGA Funds Management, Inc. is an affiliate of State Street Global Advisors Limited.
Intellectual Property Disclosures:
Standard & Poor’s®, S&P® and SPDR® are registered trademarks of Standard & Poor’s® Financial Services LLC (S&P); Dow Jones is a registered trademark of Dow Jones Trademark Holdings LLC (Dow Jones); and these trademarks have been licensed for use by S&P Dow Jones Indices LLC (SPDJI) and sublicensed for certain purposes by State Street Corporation. State Street Corporation’s financial products are not sponsored, endorsed, sold or promoted by SPDJI, Dow Jones, S&P, their respective affiliates and third party licensors and none of such parties make any representation regarding the advisability of investing in such product(s) nor do they have any liability in relation thereto, including for any errors, omissions, or interruptions of any index.
BLOOMBERG®, a trademark and service mark of Bloomberg Finance, L.P. and its affiliates, and BARCLAYS®, a trademark and service mark of Barclays Bank Plc., have each been licensed for use in connection with the listing and trading of the SPDR Bloomberg Barclays ETFs.
Distributor: State Street Global Advisors Funds Distributors, LLC, member FINRA, SIPC, an indirect wholly owned subsidiary of State Street Corporation. References to State Street may include State Street Corporation and its affiliates. Certain State Street affiliates provide services and receive fees from the SPDR ETFs.
ALPS Distributors, Inc., member FINRA, is distributor for SPDR® S&P 500®, SPDR® S&P MidCap 400® and SPDR® Dow Jones Industrial Average, all unit investment trusts. ALPS Distributors, Inc. is not affiliated with State Street Global Advisors Funds Distributors, LLC.
Before investing, consider the funds’ investment objectives, risks, charges, and expenses. For SPDR funds, you may obtain a prospectus or summary prospectus containing this and other information by calling 1‐866‐787‐2257 or visiting www.spdrs.com. Please read the prospectus carefully before investing.
Disclosure: Interactive Brokers
Information posted on IBKR Campus that is provided by third-parties does NOT constitute a recommendation that you should contract for the services of that third party. Third-party participants who contribute to IBKR Campus are independent of Interactive Brokers and Interactive Brokers does not make any representations or warranties concerning the services offered, their past or future performance, or the accuracy of the information provided by the third party. Past performance is no guarantee of future results.
This material is from State Street Global Advisors and is being posted with its permission. The views expressed in this material are solely those of the author and/or State Street Global Advisors and Interactive Brokers is not endorsing or recommending any investment or trading discussed in the material. This material is not and should not be construed as an offer to buy or sell any security. It should not be construed as research or investment advice or a recommendation to buy, sell or hold any security or commodity. This material does not and is not intended to take into account the particular financial conditions, investment objectives or requirements of individual customers. Before acting on this material, you should consider whether it is suitable for your particular circumstances and, as necessary, seek professional advice.
Disclosure: Futures Trading
Futures are not suitable for all investors. The amount you may lose may be greater than your initial investment. Before trading futures, please read the CFTC Risk Disclosure. A copy and additional information are available at ibkr.com.


