


I must admit, sometimes these pieces kind of write themselves. There are mornings when a news item or market development is so compelling that I would be remiss not to comment upon it. There are other mornings where I believe that I found a meaningful, tradeable nuance that has been generally overlooked. Then there are mornings when I feel the need to rant. This is one of them.
Yes, I could fill today’s piece with observations about the mild end-of-month pullback that we’re seeing this morning, or how investors have become so inured to better-than-expected results during this quarterly earnings season that they are only mildly rewarding Amazon (AMZN) for a massive earnings beat[i] and thrashing Twitter (TWTR) for a miss. I could look ahead to the coming month and muse whether “sell in May” is appropriate this year and how delaying the income tax deadline might influence that decision. Any of those would make eminently readable articles. But today I want to rant.
I love charts and helpful annotations. Many of these useful indicators can be placed on a chart using annotations. This is when I would like to ask that you, dear reader, NEVER USE THE ARROW!
My first real job was serving as a summer intern for a technical analyst, and many of those lessons have stayed with me throughout my career. Chart reading is highly subjective, thus error-prone, and I’ve yet to find or learn of the Holy Grail – a truly foolproof technical analysis-based trading system. That said, charts are indispensable for determining support and resistance levels, trends, and consolidation. All of those can be extraordinarily helpful for trading decisions. If a stock is falling, I would like to know if there is a level where buyers may step in. If a stock is clearly in a downtrend, I would be more likely to sell rallies than buy dips (and vice versa). Are there clues to let me know whether to follow a strong trend or trade around a sideways market? Trading is about managing risk and reward. I know that no technical indicator or system is perfect, but I have learned how to use some of them to improve my odds.
That said, a chart like this is my pet peeve:
MSFT 6 Month Daily Bars
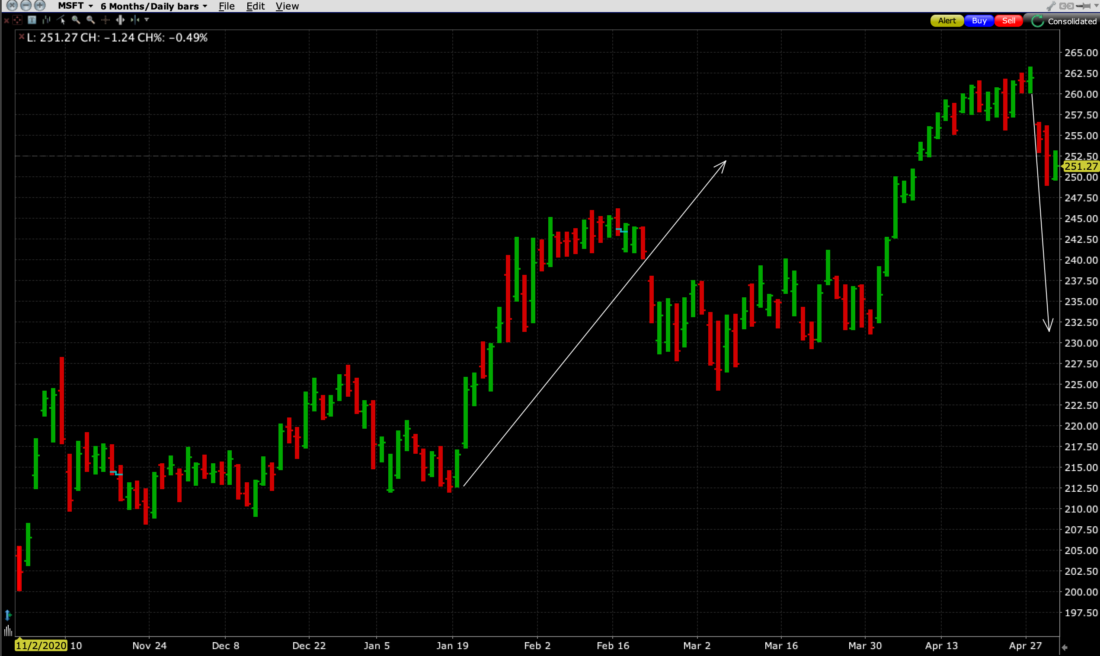
Source: Interactive Brokers
What is the point of those arrows? They are gratuitous, the chartist’s equivalent of putting his thumb on the scale. They are all too often used to extrapolate a trend or illustrate a countertrend move that has not yet revealed itself. I’ve seen more of these unnecessary arrows than usual lately, and I find them uninformative at best, dishonest at worst.
Earlier this week, I used charts to illustrate what the options market was anticipating for post-earnings moves in Microsoft (MSFT) and Alphabet (GOOG, GOOGL). I used a chart that was quite similar to the one above to illustrate the extended short-term move in MSFT (without arrows and of course without post-earnings prices). My conclusion was that “traders would be quite unprepared if results fail to impress investors.“ Since MSFT options implied that the most likely outcome was a modest increase, despite the stock having spiked in the prior month, any failure to impress would offer the potential for a selloff. Later that day, MSFT reported fiscal year third-quarter earnings per share of $1.95, significantly higher than the $1.78 expectation. Despite beating on several metrics, investors were unimpressed with MSFT and the stock retreated.
A trader reacting to the disappointment would have noted that the stock seemed extended, and that a potential downside target was to close the gap around $250 and find support around that level or slightly below. Would the downward arrow in the above chart have helped any trader’s decision process? I think not.
A friend of mine pushed me over the edge with charts like the following:
SPX 1 Year Bars

Source: Interactive Brokers
My friend has become very concerned that equity markets have become dangerously overbought. He makes some useful arguments about extended valuations and unrealistic expectations. Despite, or maybe because of, the prolonged uptrends in financial assets there are several potential warning signs for investors that may be overlooked. But then he undermines his points with a gratuitous downward arrow at the end of his graph, usually with a further annotation like “Crash Coming.” It infuriates me to see him subvert his logic with a random arrow. And this is not limited to bears. I have seen more than my share of bullish charts, many in the cryptocurrency space, with arrows that infinitely extrapolate current strength into the stratosphere. We can all be guilty of silly extrapolation. Shortly after I joined Timber Hill we implemented a slight change to our model that offered to improve our daily results. It worked really well on the first day, so much so that our then head trader – a skilled quant – did some furious calculations and said “if we keep up at this rate we’ll make hundreds of millions in a year.” My colleagues and I chided him, and he realized his mistake. The strategy was indeed profitable, but more modestly. The arrow on the chart offers the same sort of logic as our trader used that day. Project a desired result onto your thinking and draw an arrow to get you there. Face it, it’s useless. And that’s my rant for today. Lose the arrow!
—
[i] One possible explanation for the relatively uninspired reaction to AMZN earnings is that the stock had run up in advance of the result, propelled partially by investor-fueled, 1999-style rumors of a stock split. There’s no split. I checked.
Disclosure: Interactive Brokers
The analysis in this material is provided for information only and is not and should not be construed as an offer to sell or the solicitation of an offer to buy any security. To the extent that this material discusses general market activity, industry or sector trends or other broad-based economic or political conditions, it should not be construed as research or investment advice. To the extent that it includes references to specific securities, commodities, currencies, or other instruments, those references do not constitute a recommendation by IBKR to buy, sell or hold such investments. This material does not and is not intended to take into account the particular financial conditions, investment objectives or requirements of individual customers. Before acting on this material, you should consider whether it is suitable for your particular circumstances and, as necessary, seek professional advice.
The views and opinions expressed herein are those of the author and do not necessarily reflect the views of Interactive Brokers, its affiliates, or its employees.
Disclosure: Tax-Related Items (Circular 230 Notice)
The information in this material is provided for informational purposes only and does not constitute tax advice and cannot be used by the recipient or any other taxpayer to avoid penalties under any federal, state, local or other tax statutes or regulations, or to resolve any tax issue.
Disclosure: Bitcoin Futures
TRADING IN BITCOIN FUTURES IS ESPECIALLY RISKY AND IS ONLY FOR CLIENTS WITH A HIGH RISK TOLERANCE AND THE FINANCIAL ABILITY TO SUSTAIN LOSSES. More information about the risk of trading Bitcoin products can be found on the IBKR website. If you're new to bitcoin, or futures in general, see Introduction to Bitcoin Futures.
Disclosure: Options Trading
Options involve risk and are not suitable for all investors. Multiple leg strategies, including spreads, will incur multiple commission charges. For more information read the "Characteristics and Risks of Standardized Options" also known as the options disclosure document (ODD) or visit ibkr.com/occ


