


1/ The SEAF Model: Faster Markets Require Better Tools
2/ How We Derive the SEAF Model Signals
3/ SEAF’s “Rainbow Charts” Identify the Trends in Money Movement
4/ Using the SEAF Model to Identify Changes in Market Sentiment
Investopedia is partnering with CMT Association on this newsletter. The contents of this newsletter are for informational and educational purposes only, however, and do not constitute investing advice. The guest authors, which may sell research to investors, and may trade or hold positions in securities mentioned herein do not represent the views of CMT Association or Investopedia. Please consult a financial advisor for investment recommendations and services.
1/ The SEAF Model: Faster Markets Require Better Tools
Courtesy of Asbury Research LLC
During the latter part of the 2010s I noticed that sector rotation was speeding up. That is, the relative trends of the individual market sectors versus the S&P 500 were faster and weren’t lasting as long. I attribute this to the continued sophistication of markets via algorithmic trading but, regardless of the reason, sector rotation is a much faster track than it used to be.
As a result, I started to search for a better way to find these trends sooner, before they became readily apparent on a relative performance chart, and to notice when they were ending faster. I started tracking the flow of money into and out of these sectors, as investor asset flows are one is one of the only metrics I know of that actually leads price movement. This research resulted in Asbury Research’s creation of the SEAF Model, which is an acronym for Sector ETF Asset Flows. The SEAF Model quantitatively identifies long / overweight opportunities in US market sectors by “following the money” as it moves around the 11 Select Sector SPDR ETFs. The model enables us see the money moving before the trends this money movement creates becomes apparent on a price chart.
2/ How We Derive the SEAF Model Signals
Courtesy of Asbury Research LLC
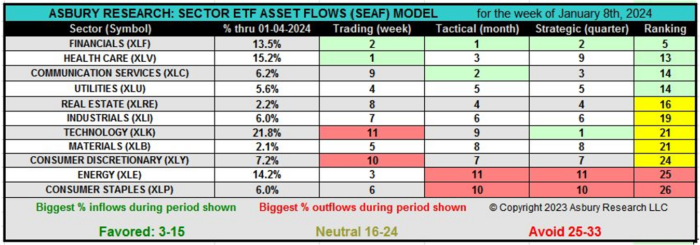
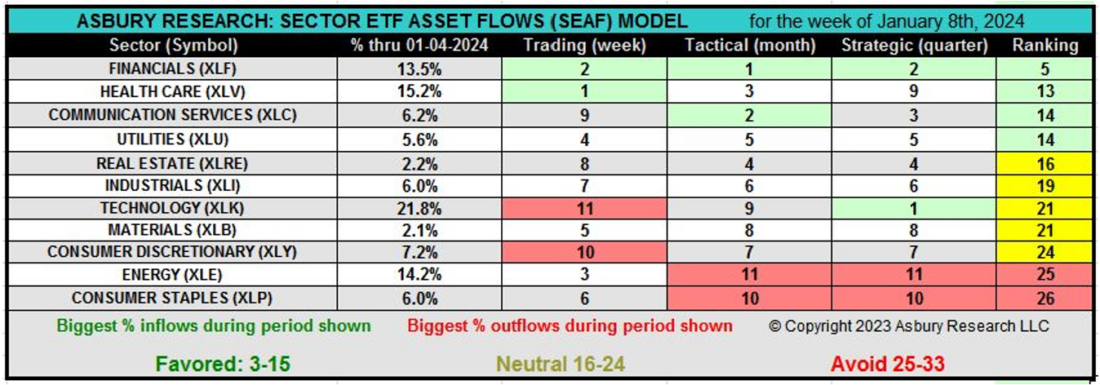
Our methodology measures the velocity of money moving into and out of the 11 sector SPDRS ETFs in three different time frames: Trading (weekly), Tactical (monthly), and Strategic (quarterly). The premise of the model is to invest in the sectors that the money is going into and to avoid the sectors the money is coming out of. The top two sectors in each category according to a positive change in inflows are highlighted in green. The top two sectors in each category according to a negative change in outflows are highlighted in red. We then add up the scores in each time period to produce a composite Ranking. Favored sectors have a Ranking between 3 and 15 (green), Neutral sectors have a Ranking between 16 and 24 (yellow), and Avoid sectors have a ranking between 25 and 33 (red). The SEAF Model is rebalanced once a week, on the weekend, to reflect the movement of money over the previous week. The chart above shows that the SEAF Model currently favors Financial (XLF), Health Care (XLV), Communication Services (XLC), and Utilities (XLU) and is avoiding Energy (XLE) and Consumer Staples (XLP).
3/ SEAF’s “Rainbow Charts” Identify the Trends in Money Movement
Courtesy of Asbury Research LLC
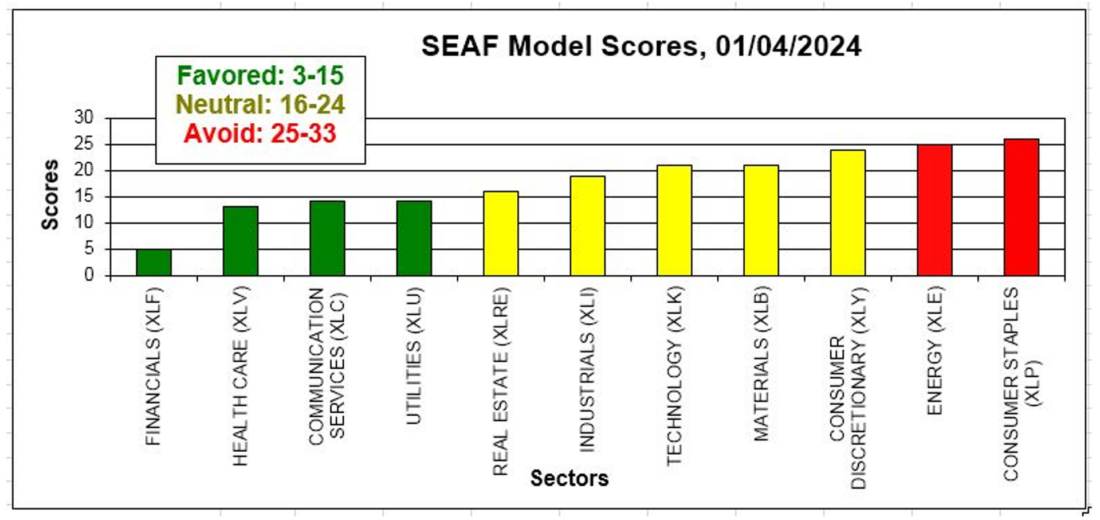
The first two graphics display the latest sector rankings according to the SEAF Model, in both table and chart form. However, the movement of investor assets moving in and out of the various sectors tend to trend just like price itself, as the movement of money is a major influences in the creation and sustainability of these trends. We created SEAF Model “Rainbow Charts” to highlight these trends.
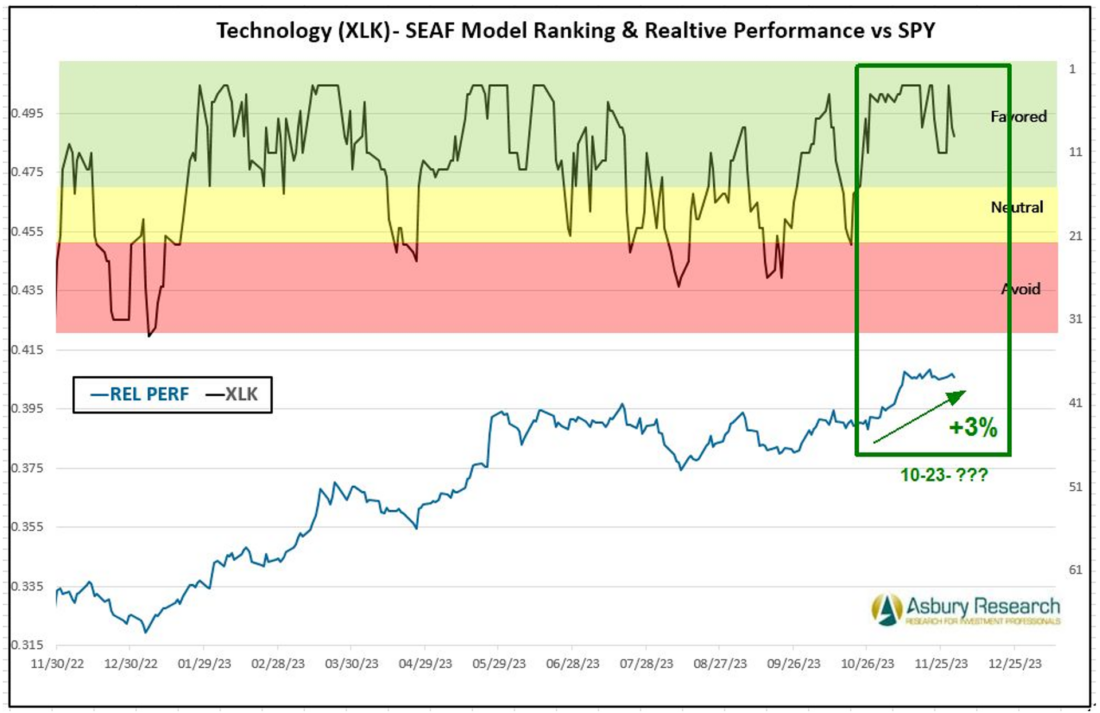
The Rainbow Chart shown includes 12 months of SEAF Model Rankings through December 1st in the upper panel, with a corresponding chart of the relative performance of the Technology Select Sector SPDR Fund (XLK) versus the SPDR S&P 500 ETF (SPY) in the lower panel. The green highlights show that the SEAF Model ranking for the XLK initially moved to a Favored status on October 23rd while (XLK) coincidentally outperformed SPY by 3% through December 1st. Not shown is that Technology subsequently moved out of Favored status on December 29th after capturing a 13.8% outright gain while outperforming the S&P 500 (SPY) by 3.5%.
4/ Using The SEAF Model To Identify Changes In Market Sentiment
In addition to indicating where the money is going in US market sectors, we use SEAF to provide us with a broader understanding of current market conditions. For example, in the SEAF Model graphic above we can see that defensive Health Care and Utilities are two of this week’s four Favored rankings. Then, on the opposite end of the spectrum, offensive Consumer Discretionary and Technology are the 10th and 11th ranked, or two weakest, sectors in the Trading (weekly) time frame. I interpret this as an early indication that investor assets are shifting from more aggressive, “risk on” sectors, where they have resided since late October, to more defensive places – perhaps in anticipation of an overdue downside correction in the US broad market. More information and data pertaining to our SEAF Model research and data driven models, including the SEAF Model, are available by clicking here.
—
Originally posted 8th January 2024
Disclosure: Investopedia
Investopedia.com: The comments, opinions and analyses expressed herein are for informational purposes only and should not be considered individual investment advice or recommendations to invest in any security or to adopt any investment strategy. While we believe the information provided herein is reliable, we do not warrant its accuracy or completeness. The views and strategies described on our content may not be suitable for all investors. Because market and economic conditions are subject to rapid change, all comments, opinions and analyses contained within our content are rendered as of the date of the posting and may change without notice. The material is not intended as a complete analysis of every material fact regarding any country, region, market, industry, investment or strategy. This information is intended for US residents only.
Disclosure: Interactive Brokers
Information posted on IBKR Campus that is provided by third-parties does NOT constitute a recommendation that you should contract for the services of that third party. Third-party participants who contribute to IBKR Campus are independent of Interactive Brokers and Interactive Brokers does not make any representations or warranties concerning the services offered, their past or future performance, or the accuracy of the information provided by the third party. Past performance is no guarantee of future results.
This material is from Investopedia and is being posted with its permission. The views expressed in this material are solely those of the author and/or Investopedia and Interactive Brokers is not endorsing or recommending any investment or trading discussed in the material. This material is not and should not be construed as an offer to buy or sell any security. It should not be construed as research or investment advice or a recommendation to buy, sell or hold any security or commodity. This material does not and is not intended to take into account the particular financial conditions, investment objectives or requirements of individual customers. Before acting on this material, you should consider whether it is suitable for your particular circumstances and, as necessary, seek professional advice.
Disclosure: ETFs
Any discussion or mention of an ETF is not to be construed as recommendation, promotion or solicitation. All investors should review and consider associated investment risks, charges and expenses of the investment company or fund prior to investing. Before acting on this material, you should consider whether it is suitable for your particular circumstances and, as necessary, seek professional advice.

Join The Conversation
If you have a general question, it may already be covered in our FAQs. If you have an account-specific question or concern, please reach out to Client Services.