


By J.C. Parets & All Star Charts
Thursday, 1st June, 2023
1/ One Base to Rule Them All
2/ Bullish Streak for META
3/ Japan Stocks Reach New 33-Year Highs
4/ Trends Persist
1/ One Base to Rule Them All
We’ve spent a lot of time talking about big bases this year. This is because a lot of stocks have endured nasty drawdowns over the past few years and have spent the past few quarters consolidating and trying to build bottoms.
However, when we analyze the median stock price performance using the Value Line Geometric Index (VLG), there is a much different takeaway. The chart below shows us that the majority of the broader market has made no progress at all for about 25 years.
Here is a monthly candlestick chart of VLG dating back to the early 1990s:

As we prepare ourselves for an environment that could be characterized by some much-needed corrective action, our focus falls on the weakest groups and indexes. Because the Value Line is agnostic to the market cap-weight issues of most indexes, it paints a more accurate picture of what the broader market is doing. And as you can see, the overall market hasn’t performed anything like the S&P 500 and Nasdaq 100 in recent history.
In fact, as illustrated by the chart above, the median stock has made no progress at all for about 25 years. While a violation of these prior-cycle highs would represent major downside risk for stocks, the very same level would make for a perfect starting point of a new bull market.
2/ Bullish Streak for META
As big tech continues to lead, Meta Platforms (META) keeps setting new highs and record bull run streaks.
As you can see in the chart, META just closed higher for the seventh consecutive month, marking its largest consecutive win rate since it came public in May 2012.

This comes after buyers stepped in and successfully reclaimed a critical shelf of former lows from 2018 and 2020. Since then, price has surged higher in a nearly vertical line.
While the stock has more than earned some digestive and corrective action considering its recent run, it is undeniable that the primary trend has once again turned higher. It appears that META has new all-time highs on its mind, and that’s where we could see the next line of resistance.
3/ Japan Stocks Reach New 33-Year Highs
Looking outside the U.S., we are seeing more and more stock market indexes reach new highs.
The chart below shows the Nikkei 225 closing at its highest level since 1990.
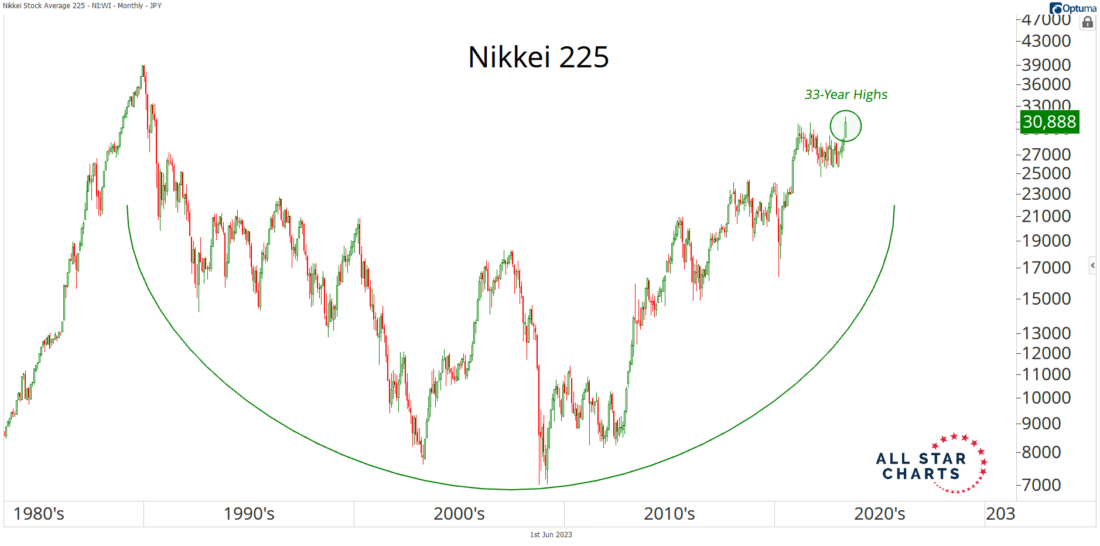
After three decades of absolutely no progress, price is taking out the pivot highs from 2021 to reach fresh 33-year highs. With that said, there isn’t much of a technical barrier preventing the price from testing its all-time highs from the late 1980s.
Seeing stocks in Japan and other countries set new highs is yet another piece of evidence suggesting that global equities remain strong.
4/ Trends Persist
While intermarket evidence suggests a breakdown in yields, they simply refuse to roll over. It makes perfect sense when we zoom out.
Rates are in a well-defined structural uptrend!
Check out the U.S. 30-year yield overlaid with live cattle futures:

The charts look almost identical, as both exhibit the classic base-on-base formation—one upside resolution followed by another.
To be clear, we’re not proposing a grand thesis regarding a strong positive correlation between long-duration rates and live cattle futures. Instead, we’re simply observing the structural trend.
If the 30-year yield chart were a risk asset, would you have a bullish outlook?
In this case, we would likely set alerts and stop orders to catch a potential break to fresh highs and, ultimately, the next leg higher.
Yes, the broader market might imply lower rates. But the structural trend remains undeniably higher until the charts prove otherwise.
—
Originally posted 1st June 2023
Disclosure: Investopedia
Investopedia.com: The comments, opinions and analyses expressed herein are for informational purposes only and should not be considered individual investment advice or recommendations to invest in any security or to adopt any investment strategy. While we believe the information provided herein is reliable, we do not warrant its accuracy or completeness. The views and strategies described on our content may not be suitable for all investors. Because market and economic conditions are subject to rapid change, all comments, opinions and analyses contained within our content are rendered as of the date of the posting and may change without notice. The material is not intended as a complete analysis of every material fact regarding any country, region, market, industry, investment or strategy. This information is intended for US residents only.
Disclosure: Interactive Brokers
Information posted on IBKR Campus that is provided by third-parties does NOT constitute a recommendation that you should contract for the services of that third party. Third-party participants who contribute to IBKR Campus are independent of Interactive Brokers and Interactive Brokers does not make any representations or warranties concerning the services offered, their past or future performance, or the accuracy of the information provided by the third party. Past performance is no guarantee of future results.
This material is from Investopedia and is being posted with its permission. The views expressed in this material are solely those of the author and/or Investopedia and Interactive Brokers is not endorsing or recommending any investment or trading discussed in the material. This material is not and should not be construed as an offer to buy or sell any security. It should not be construed as research or investment advice or a recommendation to buy, sell or hold any security or commodity. This material does not and is not intended to take into account the particular financial conditions, investment objectives or requirements of individual customers. Before acting on this material, you should consider whether it is suitable for your particular circumstances and, as necessary, seek professional advice.
Disclosure: ETFs
Any discussion or mention of an ETF is not to be construed as recommendation, promotion or solicitation. All investors should review and consider associated investment risks, charges and expenses of the investment company or fund prior to investing. Before acting on this material, you should consider whether it is suitable for your particular circumstances and, as necessary, seek professional advice.
Disclosure: Futures Trading
Futures are not suitable for all investors. The amount you may lose may be greater than your initial investment. Before trading futures, please read the CFTC Risk Disclosure. A copy and additional information are available at ibkr.com.

Join The Conversation
If you have a general question, it may already be covered in our FAQs. If you have an account-specific question or concern, please reach out to Client Services.