


From SIA Charts
1/ Qualcomm Inc. (QCOM)
2/ Candlestick Chart
3/ Point and Figure Chart
Investopedia is partnering with CMT Association on this newsletter. The contents of this newsletter are for informational and educational purposes only, however, and do not constitute investing advice. The guest authors, which may sell research to investors, and may trade or hold positions in securities mentioned herein do not represent the views of CMT Association or Investopedia. Please consult a financial advisor for investment recommendations and services.
1/
Qualcomm Inc. (QCOM)
Courtesy of SIA Charts
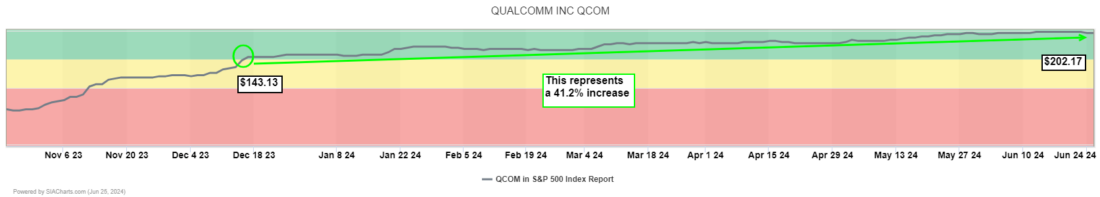
SIA Charts’ relative strength rankings help investors manage risk by identifying stocks and sectors which are relatively underperforming in the short or long term to potentially be avoided as capital appears to be seeking better opportunities elsewhere.
Today, we are going to look at Qualcomm Inc (QCOM) which we last commented on the December 21, 2023, edition of the Daily Stock Report. QCOM first entered the Green Favored Zone of the SIA S&P 500 Index earlier that week on December 15th at a price of $143.13. The shares have remained in the favored Zone ever since and the closing price of the shares is now at $202.17 representing at 41.2% price increase in a little over 6 months’ time. In contrast, the S&P 500 Index is up 15.9% in the same time frame. Yesterday, QCOM finished in 13th position, up 6 spots on the month and up 44 places in the last quarter.
2/
Candlestick Chart
In looking at the attached Candlestick chart of Qualcomm Inc, we see that the shares ultimately found its bottom back in October of 2022, May of 2023 and October of 2023 forming a nice triple bottom pattern. The accumulation phase took over with a strong uptrend forming since then. A pattern of higher lows and higher highs has materialized which is still intact today. The shares really took off when it broke above a neckline at the $130.00 area back in December.
After such a parabolic move, the shares have pulled back earlier this month as a potential sign of near-term exhaustion. Support can be found at the $180.00 area which it achieved back in late 2021. Resistance is at its all-time highs near the $215.00 to 230.00 range. It will be interesting to see going forward if the shares can break past the $215.00 to $230.00 resistance level and march onto new all-time highs.

Courtesy of SIA Charts
3/
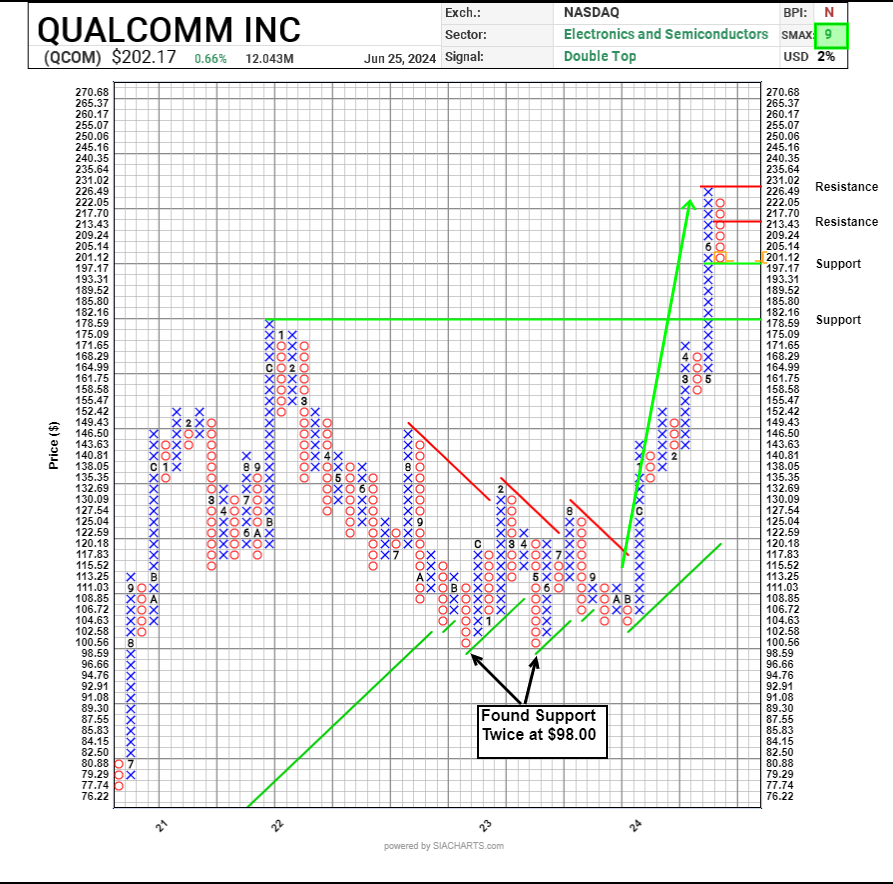
Point and Figure Chart
In the attached Point and Figure chart at a 2% scale, we see the share’s strong uptrend from 2020 to its peak of $182.00 back in December of 2021. Then the shares reversed course, and the one-year distribution phase took over from December 2021 to December 2022. At that time, we see the shares found support twice in December 2021 and May of 2022. Then finding further support a little higher three times at the $102.00 area in late 2022 as well as September and November of 2023. The shares changed trend to the upside since then with a very strong move between December of last year up until earlier this month. With such a strong move in a short period of time, the shares pulled back into a column of O’s and now is approaching a near term support area of $197.17 based on a 50% retracement. Further support below that, is at $178.59. On the upside, resistance can be found at its 3-box reversal of $217.70 and, above that, its recent all time high at $231.02. The shares currently still exhibit at bullish Double Top pattern. With a bullish SMAX score (which is a near-term 1 to 90-day indicator comparing an asset against different equal-weight asset classes) of 9 out of 10, QCOM is exhibiting short-term strength against the asset classes.
Courtesy of SIA Charts
—
Originally posted 27th June 2024
Disclosure: ETFs
Any discussion or mention of an ETF is not to be construed as recommendation, promotion or solicitation. All investors should review and consider associated investment risks, charges and expenses of the investment company or fund prior to investing. Before acting on this material, you should consider whether it is suitable for your particular circumstances and, as necessary, seek professional advice.

Join The Conversation
If you have a general question, it may already be covered in our FAQs. If you have an account-specific question or concern, please reach out to Client Services.