


")


I’ve been trying to come up with the proper comparison for the recent movements in the stock markets. Yo-yo, bucking bronco, coiled spring, and several others have popped into my head. Rather than using tired cliches, let’s let some pictures provide the description:
S&P 500 Index (SPX), 1 Week Chart, 2 Minute Bars
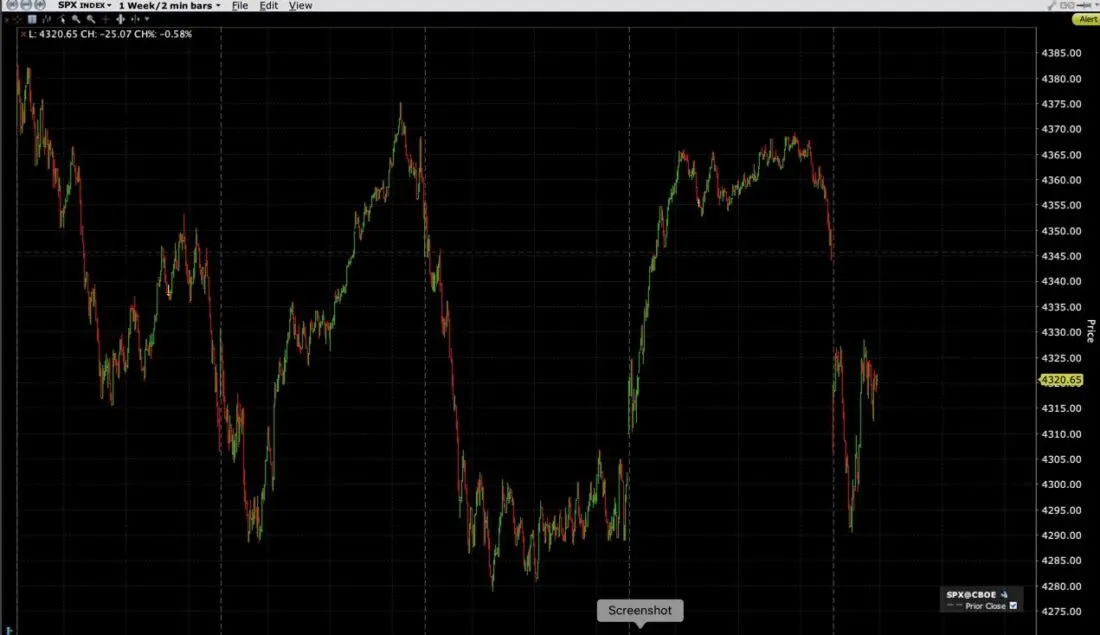
Source: Interactive Brokers
NASDAQ 100 Index (NDX), 1 Week Chart, 2 Minute Bars

Source: Interactive Brokers
CBOE Volatility Index (VIX), 1 Week Chart, 2 Minute Bars

Source: Interactive Brokers
The theme should be quite clear. Markets have been bouncing up and down after a recent drop. On last Friday and yesterday, we saw indices try to regain the ground they lost on the prior day.
It didn’t bother me that markets tried to bounce. That is to be expected after a sizeable drop, and SPX had fallen over 1% on Thursday and Monday. What bothered me is the way they bounced and the character of the moves. We opened higher, which is to be expected in an environment when “buy-the-dip” has been a generally reliable strategy, but the relentless follow-through seemed much more like traders simply chasing moves than investors pursuing fresh values. Notice how we dropped as we approached the close on each of those rally days. I read that as traders not wanting to go home long after chasing higher prices all day. Unfortunately, Friday’s rally appeared to be a sucker’s rally, and it remains quite possible that yesterday’s bounce could prove to be another. Fool me once, shame on you; fool me twice, shame on me.
SPX Implied Volatility (white), 10 Day (yellow) and 30 Day (orange) Historical Volatilities

Source: Interactive Brokers
It is quite clear that we have entered a period of higher volatility, as evidenced by the graph above. We can certainly debate whether the volatility is transitory or persistent. It is my contention that the prospects for monetary and fiscal stimuli have become much more uncertain, and uncertainty begets volatility. That’s what makes markets. It depends upon the likely pace of Fed tapering, whether this Friday’s payroll numbers might boost employment sufficiently to push forward a potential interest rate hike, and whether Congress can get its act together regarding the debt ceiling, infrastructure spending and a budget reconciliation. If those all get resolved quickly and to the market’s liking, volatility should ebb. If not, the market yo-yo could keep bouncing along.
Disclosure: Interactive Brokers
The analysis in this material is provided for information only and is not and should not be construed as an offer to sell or the solicitation of an offer to buy any security. To the extent that this material discusses general market activity, industry or sector trends or other broad-based economic or political conditions, it should not be construed as research or investment advice. To the extent that it includes references to specific securities, commodities, currencies, or other instruments, those references do not constitute a recommendation by IBKR to buy, sell or hold such investments. This material does not and is not intended to take into account the particular financial conditions, investment objectives or requirements of individual customers. Before acting on this material, you should consider whether it is suitable for your particular circumstances and, as necessary, seek professional advice.
The views and opinions expressed herein are those of the author and do not necessarily reflect the views of Interactive Brokers, its affiliates, or its employees.
Disclosure: Futures Trading
Futures are not suitable for all investors. The amount you may lose may be greater than your initial investment. Before trading futures, please read the CFTC Risk Disclosure. A copy and additional information are available at ibkr.com.


")
