


The Nasdaq-100 has been a stellar performer since its debut in 1985, rising 22,900% (with dividends reinvested) for a 14.8% compounded annual total rate of return. By comparison, the S&P 500 returned 7,200% over the same period with dividends reinvested, an 11.5% compounded return (Figure 1).
Figure 1: Since the inception of the Nasdaq-100 index in 1985, it has outperformed the S&P

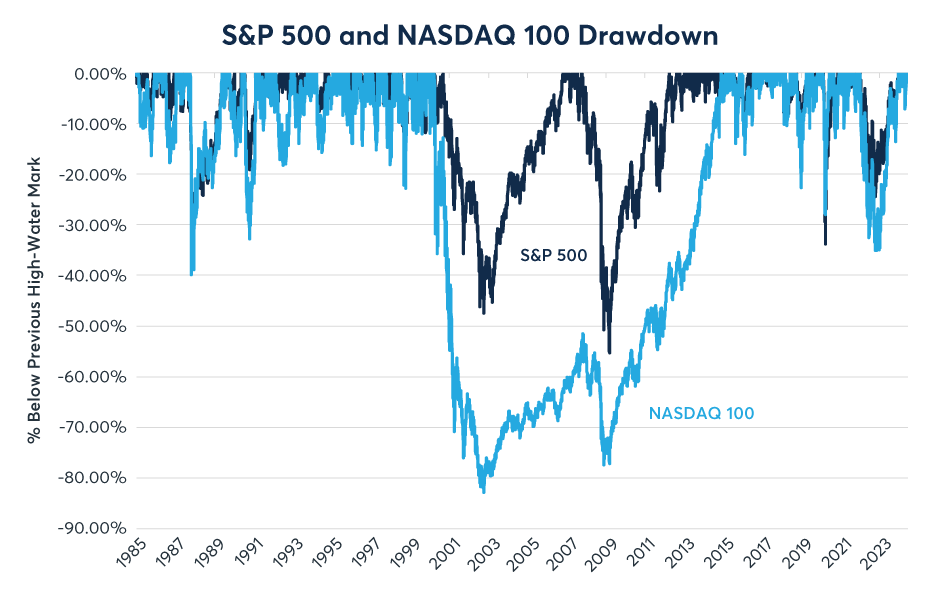
However, the Nasdaq’s outperformance can partly be attributed to higher risk levels. It has been consistently more volatile than the S&P 500 (Figure 2) and has been subject to much greater drawdowns. On March 28, 2000, Nasdaq began a drawdown that reached -81.76% on August 5, 2002 (Figure 3). The total return index didn’t hit a new high-water mark until February 12, 2015. It also had a sharper drawdown during the 2022 bear market.
Figure 2: The Nasdaq-100 has nearly always been more volatile than the S&P 500
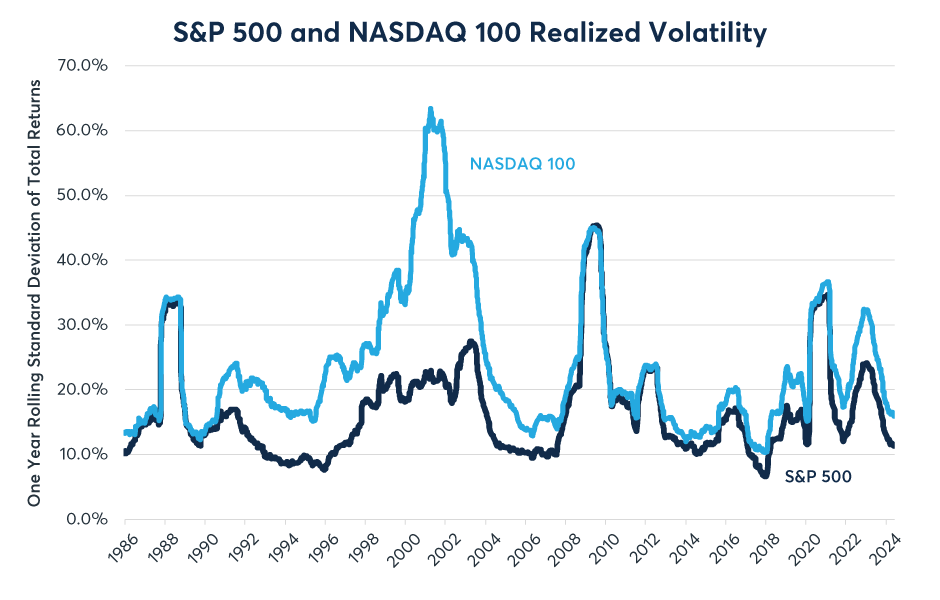
Figure 3: From 2000 to 2002, the Nasdaq-100 fell by nearly 82% and didn’t recover until 2015.
A large part of the reason for the Nasdaq’s greater overall return, higher volatility and its heightened susceptibility to deep and long drawdowns is its dependence on one sector: information technology. Since at least the 1990s, Nasdaq has been nearly synonymous with the tech sector.
While nearly every sector has at least some presence in the Nasdaq, since its launch in 1999 it has always had a near-perfect correlation with the S&P 500 Information Technology Index (the basis for the S&P E-Mini Technology Select Sector futures launched in 2011). That correlation has never fallen below +0.9 and has sometimes been as high as +0.98. In the past 12 months the correlation has been +0.95 (Figure 4).
Figure 4: The Nasdaq-100 has always had extremely high correlations with the tech sector

The preponderance of technology stocks in the Nasdaq is largely a function of history. Nasdaq was founded in 1971 as the world’s first electronic stock market and it began to attract technology companies, in part, because it had more flexible listing requirements regarding revenue and profitability than other venues. Over time the technology ecosystem settled largely on this market and came to dominate the Nasdaq-100 Index.
Those who need to minimize tracking risks with respect to the S&P 500 Information Technology Index can do so with the Select Sector futures. However, those who wish to increase or decrease exposure to the technology sector more generally, and for whom tracking risks is a less of a concern can easily increase or reduce their exposure with the Nasdaq-100 futures.
Also launched in June 1999 were E-mini Nasdaq-100 futures, which are now turning 25 years old. The contracts caught on quickly, and today trade at more than 668K contracts or $60 billion in notional value each day.
E-mini Nasdaq-100 futures offer capital-efficient exposure to the Nasdaq-100 index, and allow investors to trade and track one NQ futures contract versus 100 stocks to achieve nearly identical exposure. These futures also help mitigate risk against the top-heavy nature of the Nasdaq-100 index, where the so-called Magnificent Seven companies—Microsoft, Apple, Nvidia, Amazon.com, Meta Platforms, Google-parent Alphabet and Tesla—have dominated recently. Broad exposure to this index acts as a hedge if the Magnificent Seven stocks decline.
The Nasdaq has also correlated highly in recent years with consumer discretionary stocks as well as telecoms. By contrast, it has typically low correlations with traditional high-dividend sectors such as consumer staples, energy and utilities which tend to be listed on other exchanges. The exception to this rule is during down markets, when stocks tend to become more highly correlated.
The Nasdaq also has very different interest rate sensitivities than its peers. For starters, high short-term interest rates seem to benefit the Nasdaq-100 companies as many of them have large reserves of cash that are earning high rates of return by sitting in T-Bills and other short-term maturities. This is a sharp contrast to the Russell 2000 index, which has suffered as Federal Reserve (Fed) rate hikes have increased the cost of financing for smaller and mid-sized firms, which borrow from banks rather than bond holders and don’t usually have substantial cash reserves.
By contrast, the Nasdaq has shown a very negative sensitivity to higher long-term bond yields. Many of the technology stocks in the Nasdaq-100 are trading at high earnings multiples. Some have market capitalization exceeding $1 trillion. Higher long-term bond yields are a potential threat because much the value of these corporations is what equity analysts might refer to as their “value in perpetuity,” meaning beyond any reasonable forecast horizon. Typically, such earnings are discounted using long-term bond yields and the higher those yields go, the lower the net present value of those future earnings. Additionally, higher long-term bond yields can also induce investors to switch out of highly volatile and expensive equity portfolios into the relatively less volatile, fixed- income securities.
The Nasdaq’s high sensitivity to long-term bond yields may explain why the index sold off so sharply in 2022 alongside a steep fall in the price of long-dated U.S. Treasuries, whose yields were rising in anticipation of Fed tightening and due to concerns about the persistence of inflation. By contrast, the Nasdaq has done well since October 2022 despite the Fed continuing to raise short-term rates through July 2023 and subsequently keeping those rates high. On the one hand, many of the cash-rich Nasdaq companies are benefitting from higher returns on their holdings of short-term securities. On the other hand, they are also benefitting from the fact that higher short-term rates have steadied long-term bond yields by making it clear that the Fed is taking inflation seriously.
This isn’t to suggest that the Nasdaq is immune from downside risks. History shows that the risks are very real, especially in the event of an economic downturn. In the 2001 tech wreck recession, the Fed cut short-term rates from 6.5% to 1% but long-term bond yields remained relatively high, which was not a helpful combination for the tech sector. In addition to its 82% decline during the tech wreck recession, it also fell sharply during the global financial crisis, though not as badly as the S&P 500, which had a far larger weighting to bank stocks.
This time around, potential threats to the Nasdaq include:
- The possibility of an economic downturn which could crimp corporate profits.
- Rate cuts which would reduce the return on cash positions.
- Large budget deficits and quantitative tightening which could push up long-term bond yields.
- Possibly tighter regulation of the tech sector in the U.S. and abroad.
—
Originally Posted June 25, 2024 – Nasdaq’s Stellar Returns, Potential Risks Ahead
All examples in this report are hypothetical interpretations of situations and are used for explanation purposes only. The views in this report reflect solely those of the author and not necessarily those of CME Group or its affiliated institutions. This report and the information herein should not be considered investment advice or the results of actual market experience.
Disclosure: Interactive Brokers
Information posted on IBKR Campus that is provided by third-parties does NOT constitute a recommendation that you should contract for the services of that third party. Third-party participants who contribute to IBKR Campus are independent of Interactive Brokers and Interactive Brokers does not make any representations or warranties concerning the services offered, their past or future performance, or the accuracy of the information provided by the third party. Past performance is no guarantee of future results.
This material is from CME Group and is being posted with its permission. The views expressed in this material are solely those of the author and/or CME Group and Interactive Brokers is not endorsing or recommending any investment or trading discussed in the material. This material is not and should not be construed as an offer to buy or sell any security. It should not be construed as research or investment advice or a recommendation to buy, sell or hold any security or commodity. This material does not and is not intended to take into account the particular financial conditions, investment objectives or requirements of individual customers. Before acting on this material, you should consider whether it is suitable for your particular circumstances and, as necessary, seek professional advice.
Disclosure: Futures Trading
Futures are not suitable for all investors. The amount you may lose may be greater than your initial investment. Before trading futures, please read the CFTC Risk Disclosure. A copy and additional information are available at ibkr.com.

Join The Conversation
If you have a general question, it may already be covered in our FAQs. If you have an account-specific question or concern, please reach out to Client Services.