


")


Yesterday was a true outlier. Around midday we noted how major US indices were recovering after sharp drops, but those rallies continued throughout the afternoon (and are continuing this morning after the slightest of stumbles). The S&P 500 Index (SPX) was down about 2.5% shortly after the open, yet closed 1.5% higher. The swings in the NASDAQ 100 (NDX) were even more dramatic, with the index opening nearly 3.5% lower only to close higher by nearly a similar amount. It was truly noteworthy, since there have only been a handful of days when US markets opened so sharply lower only to close with similar sized rallies. Those with a strong sense of market history should find timing of those prior occurrences to be quite auspicious.
According to Bespoke Investment, there were only two other times when QQQ, the Invesco ETF based on the NASDAQ 100 Index (NDX) gapped down 3% on the opening only to close 3% higher. Those dates were April 27, 2000 and May 4, 2001. Those specific dates may not ring a bell, but the years should. Let’s see what happened leading up to and after those dates:
NASDAQ 100 3-Year Daily Chart, 2000-2002, with Vertical Lines Highlighting 4/27/00 (red) and 5/4/01 (green)
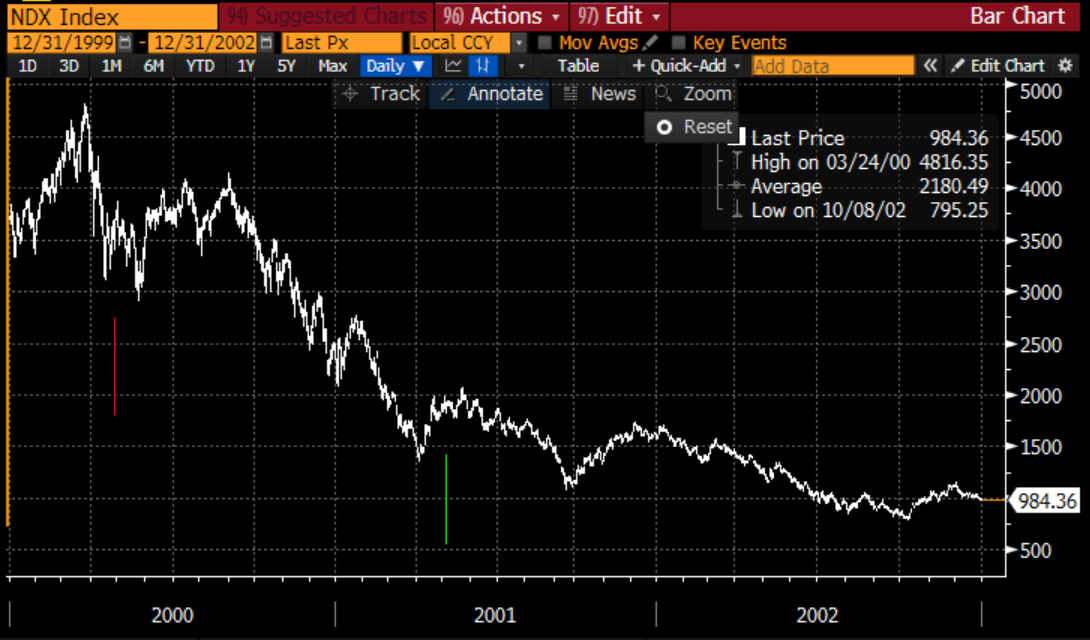
Source: Bloomberg
We see that each of those days occurred during relatively volatile periods, and that while they may have rewarded short-term traders, they proved to be lousy times to invest.
A similar statistic was provided by Dow Jones, when they noted that the last time the o Composite Index was down by more than 3% only to close 3% higher was on November 13, 2008. Traders would have been much better off selling that rally. Long-term investors would have been rewarded, but only after several months that included large drawdowns:
NASDAQ Composite 2-Year Daily Chart, 2008-2009, with Vertical Line Highlighting 11/13/08 (green)
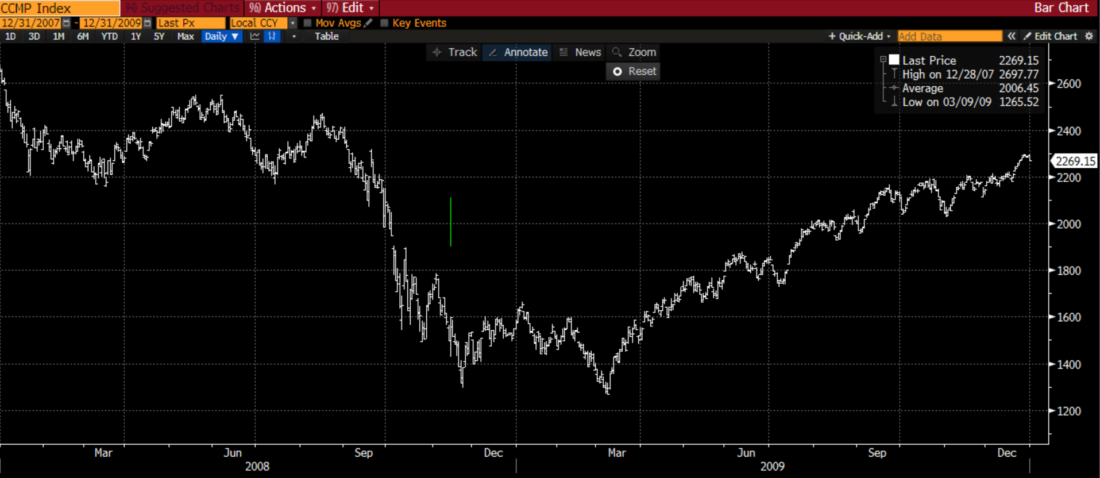
Source: Bloomberg
It will takes quite some time until it becomes apparent whether 2022 requires a place in market history similar to those of 2000-2001 and 2007-2009 – and those who are long equites should hope that this year does not join those – but we should keep their lessons in mind. Remember that both occurred as monetary conditions tightened after periods of remarkable growth in asset prices. Tech stocks led the growth in the former period, while subprime mortgages led in the latter. One could point to potential excesses in a wide range of speculative assets in the current environment as a possible point of fragility.
One of those speculative asset classes that have sprung up with dot-com era enthusiasm is cryptocurrency. We have discussed the pros and cons of crypto and blockchain as the bases for investment on numerous occasions, but we have been quite consistent in our rejection of the oft-stated assertion that crypto acts as a hedge for market uncertainty. As the events of this week unfolded it became apparent that bitcoin was moving in lockstep with stocks, at least during market hours:
4-Day Intraday Chart, Bitcoin (CME CF Bitcoin Real Time Index, BRTI) vs. NDX, Daily from 9:30 to 16:00 EST
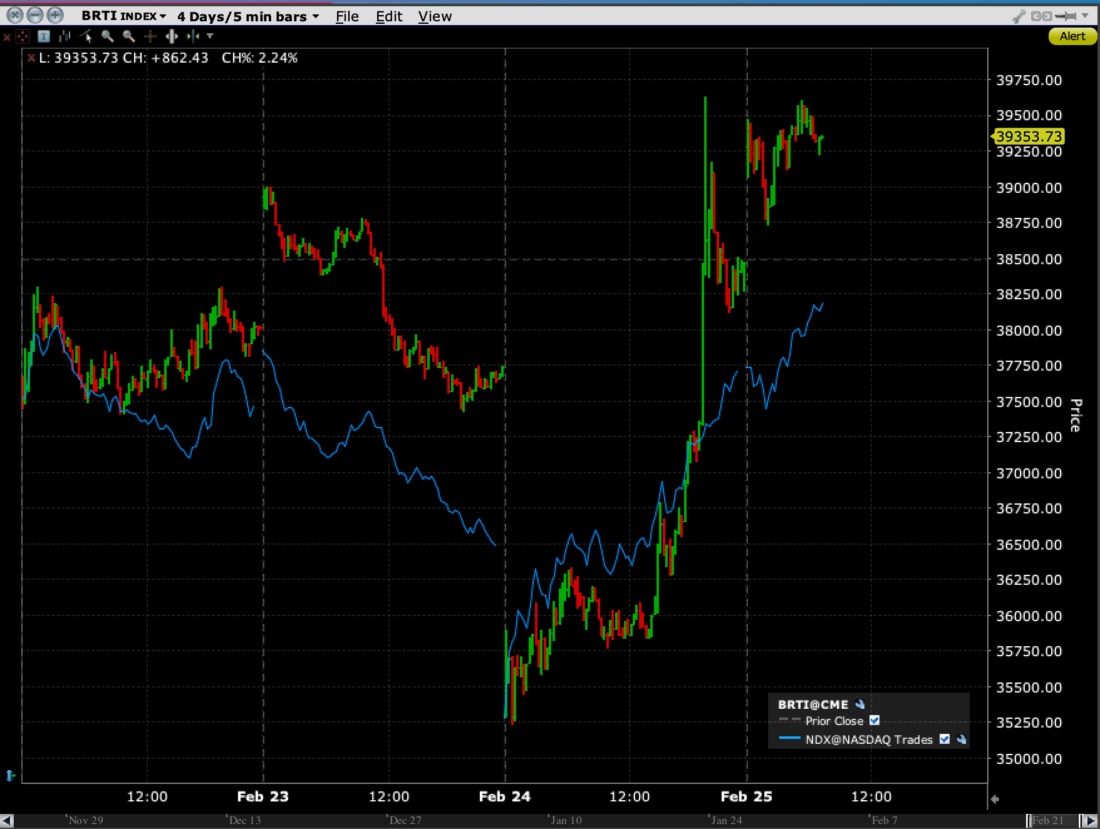
Source: Interactive Brokers
Over the long term is remains possible that cryptocurrencies could act as a hedge for dollar-based assets, but during a week that was undoubtedly one of crisis, bitcoin’s moves have essentially mirrored those of NDX.
Remember of course that markets were already volatile well before the Ukraine crisis moved to center stage. The reason of course was the changing stances of global central banks about their post-Covid monetary accommodation. While we have heard a wide range of statements from Federal Reserve governors about whether rate hikes are required, and if so, how many, they haven’t actually implemented any yet. The jawboning is the Fed’s mechanism for price discovery, a way to see what might spook or be tolerated by investors. In the meantime, they have committed to a reduction in their monthly bond purchases. Those should be ebbing sharply and ending completely by next month. Yet the Fed’s holdings of securities on its balance sheet continues to grow, as shown below:
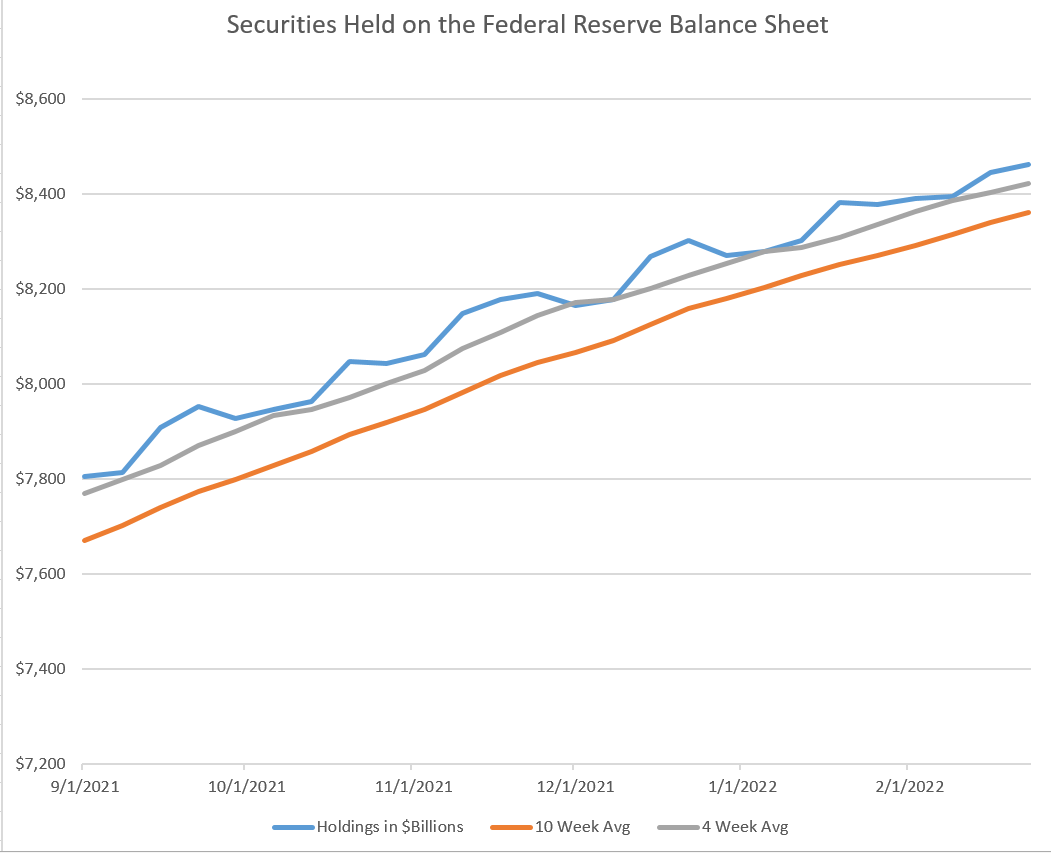
Source: Interactive Brokers, Federal Reserve H.4.1 Releases
The pace of growth has indeed slowed slightly, but continues nonetheless. The amount grew by $83 billion from January 26th to February 23rd. That is certainly below the prior pace of $120 billion per month, but well above the $30 billion or so that the FOMC statements would indicate. It is important to bear in mind that reverse repo activity continues to be roughly $1.6 trillion per day, meaning that the system is still awash with money:
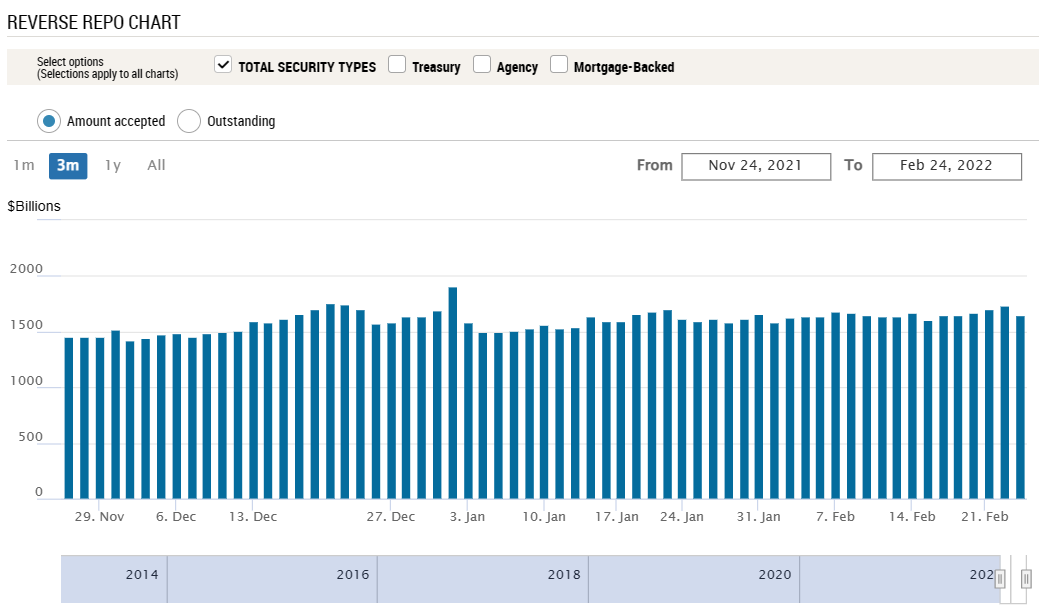
The implications are clear. The tide of money is still positive, and it should provide a cushion for nervous markets as long as that remains the case. But when we consider that monetary conditions are supposed to be changing, volatility should persist if the monetary tide actually ebbs as expected.
At the risk of being too gloomy, the well-known strategist Larry McMillan points out that the market crashes of 1929 and 1987 both occurred 55 days after markets topped out in those years. This coming Monday, February 28th will be 55 days from the January high-water market. Gulp. But bear in mind that markets reached a multitude of all-time highs before and since with little of note occurring 55 days later.
Disclosure: Interactive Brokers
The analysis in this material is provided for information only and is not and should not be construed as an offer to sell or the solicitation of an offer to buy any security. To the extent that this material discusses general market activity, industry or sector trends or other broad-based economic or political conditions, it should not be construed as research or investment advice. To the extent that it includes references to specific securities, commodities, currencies, or other instruments, those references do not constitute a recommendation by IBKR to buy, sell or hold such investments. This material does not and is not intended to take into account the particular financial conditions, investment objectives or requirements of individual customers. Before acting on this material, you should consider whether it is suitable for your particular circumstances and, as necessary, seek professional advice.
The views and opinions expressed herein are those of the author and do not necessarily reflect the views of Interactive Brokers, its affiliates, or its employees.
Disclosure: Bitcoin Futures
TRADING IN BITCOIN FUTURES IS ESPECIALLY RISKY AND IS ONLY FOR CLIENTS WITH A HIGH RISK TOLERANCE AND THE FINANCIAL ABILITY TO SUSTAIN LOSSES. More information about the risk of trading Bitcoin products can be found on the IBKR website. If you're new to bitcoin, or futures in general, see Introduction to Bitcoin Futures.
Disclosure: Futures Trading
Futures are not suitable for all investors. The amount you may lose may be greater than your initial investment. Before trading futures, please read the CFTC Risk Disclosure. A copy and additional information are available at ibkr.com.


")
