


")


Several (many?) years ago, as trading was becoming more machine-driven and less centered around physical trading-floors, we began asking some of our talented floor traders from around the country’s exchanges to join us on the desk at our Greenwich headquarters. Our newly relocated colleagues from the Pacific exchange (“the P-coast”) brought a curious expression with them – “the noon balloon”. The floor traders in San Francisco noticed that markets often rallied in the last hour of the day, which begins at noon local time. Hence the “noon balloon” phrase.
For most of the past few months, the idea of the “noon balloon” held – though it occurred around noon Eastern, not Pacific Time. Through most of the summer I noticed that we tended to rally shortly after 11:30. (“Noon balloon” has a much better ring to it than whatever I could come up with to rhyme with “eleven-thirty”) It was as though US traders were waiting for their comparatively dour European counterparts to head home. The chart below shows intraday trading in the S&P 500 Index (SPX) from 11:30 Eastern each day from June 21st through August 20th:
SPX Intraday Chart, 11:30 – 16:15 Eastern, June 21st – August 20th
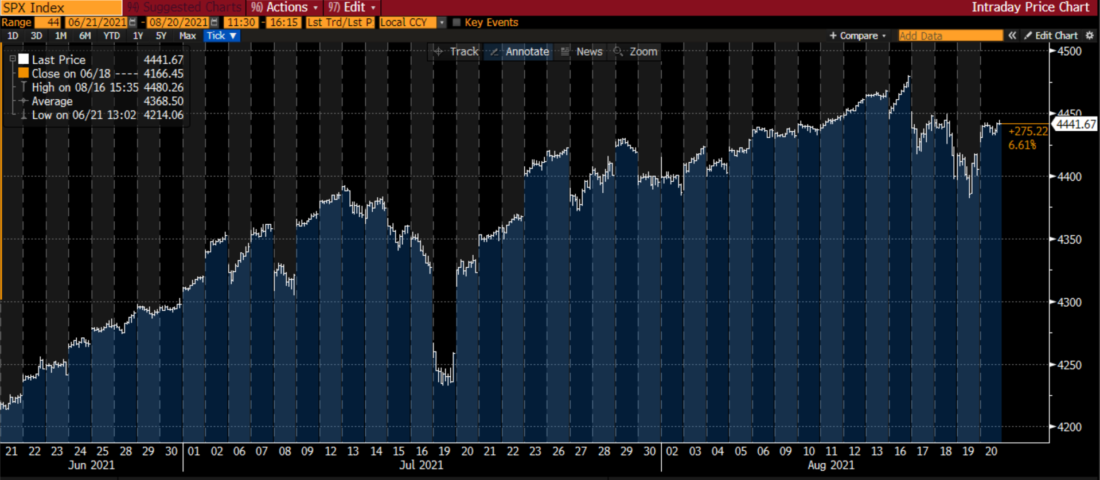
Source: Bloomberg
With the obvious exceptions of the periods around July and August expiration weeks, we see a seemingly relentless rise during the afternoons. To be fair, we saw a pretty much relentless rise in the markets overall, but even the rare down days sometimes showed sideways to higher moves in the afternoon session. Few traders would be blamed if they considered it a reliable strategy to buy US markets when Europe closed unless it was an expiration week.
Yet over the past few sessions I have noticed a change in SPX trading patterns from 11:30 on. Consider the following graph, which covers the same intraday time span since August 23rd:
SPX Intraday Chart, 11:30 – 16:15 Eastern, August 23rd – September 9th

Source: Bloomberg
The change should be fairly obvious. Most days show SPX trading sideways to lower from 11:30 on, even on up days. It is as though traders were accustomed to buying pre-open and throughout the morning but began to discover that the usual afternoon follow-through was not forthcoming. I’m going to call this the “noon swoon”.
We addressed this topic for the first time last week. At the time, we considered it a potential curiosity – something that might be interesting, but it was premature to draw any conclusions. With the pattern continuing for another week, it still may be premature to consider selling at 11:30 to be a reliable trading strategy, but it certainly seems to be persisting – at least for now.
We spelled out a potential rationale for the change last week, and I believe that it still holds today:
“Traders who notice this pattern must now try to determine why this is occurring. My theory is that institutions are not buying as actively. Large funds tend to work their orders throughout the day, and those traders try to beat either the close or VWAP. I suspect that smaller traders are driving up futures overnight and not getting follow through from institutional buying in the afternoon. It could be the result of nothing more meaningful than portfolio managers taking late summer vacations. But if we see the pattern persist, based on declining institutional buying in the marketplace, that could bode trouble as we enter a seasonally difficult period.”
When we combine that with the concept of “fully-invested bears” that we first discussed weeks ago and again yesterday, that rationale makes sense. Institutional investors could certainly be much less aggressive at adding to positions. We are entering a seasonally difficult period amidst a lack of clarity regarding the pace of future fiscal and monetary accommodation. If the Federal Reserve is considering whether to take its proverbial foot off the gas pedal, can you blame investors for doing the same?
There has been something of a change for options hedgers, though it has been far less pronounced. The graphs below show the CBOE Volatility Index (VIX) over the same periods as the SPX graphs above. One might expect that there could have been a reliable opportunity to sell volatility at 11:30 throughout the summer and to buy it now at that same time. But the graphs show otherwise:
VIX Intraday Chart, 11:30 – 16:15 Eastern, June 21st – August 20th

Source: Bloomberg
SPX Intraday Chart, 11:30 – 16:15 Eastern, August 23rd – September 9th

Source: Bloomberg
The takeaways that I would offer are these: even the most reliable trading patterns can change without notice, and that while VIX may tend to follow SPX, the correlation is by no means perfect and does not always follow the same timeframe. But at least for now, the “noon balloon” has seemingly become a “noon swoon”.
Disclosure: Interactive Brokers
The analysis in this material is provided for information only and is not and should not be construed as an offer to sell or the solicitation of an offer to buy any security. To the extent that this material discusses general market activity, industry or sector trends or other broad-based economic or political conditions, it should not be construed as research or investment advice. To the extent that it includes references to specific securities, commodities, currencies, or other instruments, those references do not constitute a recommendation by IBKR to buy, sell or hold such investments. This material does not and is not intended to take into account the particular financial conditions, investment objectives or requirements of individual customers. Before acting on this material, you should consider whether it is suitable for your particular circumstances and, as necessary, seek professional advice.
The views and opinions expressed herein are those of the author and do not necessarily reflect the views of Interactive Brokers, its affiliates, or its employees.
Disclosure: Options Trading
Options involve risk and are not suitable for all investors. Multiple leg strategies, including spreads, will incur multiple commission charges. For more information read the "Characteristics and Risks of Standardized Options" also known as the options disclosure document (ODD) or visit ibkr.com/occ
Disclosure: Futures Trading
Futures are not suitable for all investors. The amount you may lose may be greater than your initial investment. Before trading futures, please read the CFTC Risk Disclosure. A copy and additional information are available at ibkr.com.


")
