


Pressure on supply chains could be easing in time for the festive season – good news for holiday shoppers as well as investors.
Supply chain issues that have weighed on the economic recovery are showing signs of easing as we approach the end of 2021. This could support growth, which slowed significantly in the third quarter, and provide at least a temporary tailwind for financial markets.
For some time now, the global chip shortage has hampered the production of a wide range of goods, from smartphones to cars.
The situation became so severe in the summer that a number of car manufacturers were forced to halt production at some of their plants. Now there are the first signs that the pressures could be starting to ease.
In their third quarter earnings reports, car manufacturers highlighted that chip supply conditions are improving.
For example, Ford said in its Q3 statement: “Semiconductor availability remains a challenge, but markedly improved from the second quarter”. Toyota said that while it had to cut the output for November, it maintained its full-year production target.
Even though normality might not return for quite some time in the chip market, it is clear that supply has started to adjust.
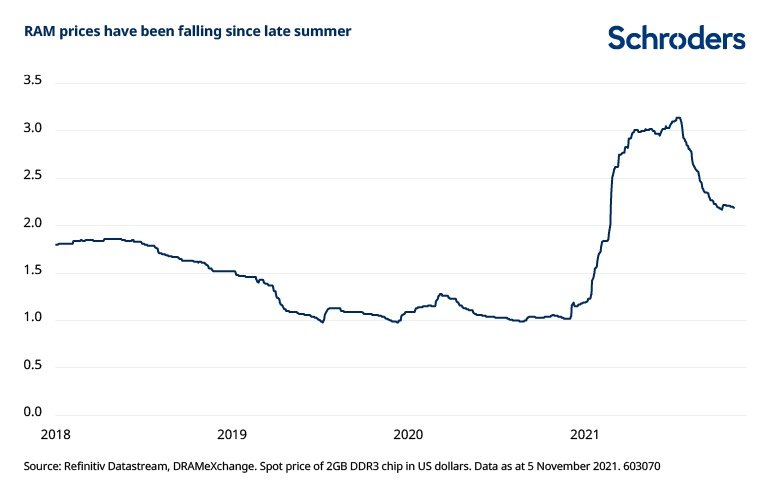
Looking at the subset of the memory chip market, RAM prices, which tripled in early 2021, have already fallen 30% since July. This highlights how higher prices become an incentive for greater supply, eventually relieving the imbalances.
On the shipping front, logjams in major ports have significantly disrupted the flow of goods. Sharp increases in goods demand and strict pandemic lockdowns in China’s manufacturing hubs and ports have resulted in skyrocketing shipping costs and increasing delivery times.
For example, the cost of shipping a 40 foot container between China and the US West Coast increased to more than $20,000 in September, four times the price at the beginning of the year (Source: Freightos).
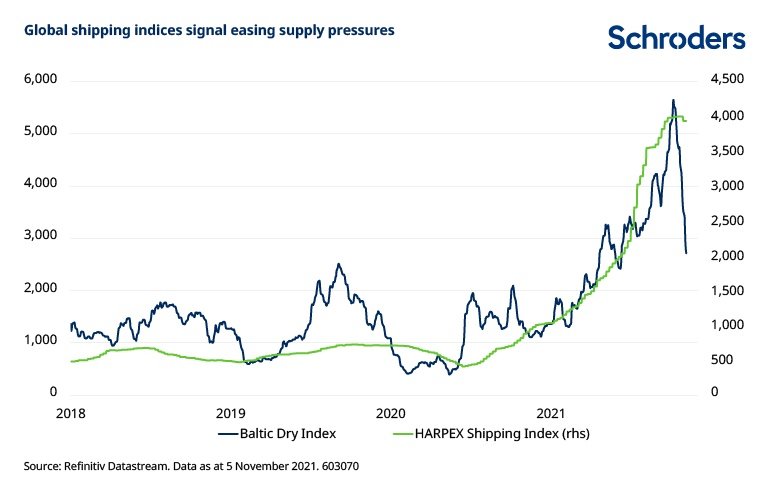
Fortunately, global shipping indices are now showing signs of peaking, with some indices already falling rapidly. The Baltic Dry Index, measuring the shipping cost of dry bulk commodities, such as iron ore or coal, has fallen more than 50% since early October.
The HARPEX Index, measuring worldwide container ship charter rates, fell in the last week of October for the first time in 16 months. The shipping cost between China to the US West Coast fell to $16,000 in early October, although it has increased slightly again in the last few weeks.
Looking ahead, global shipping costs are likely to remain elevated as goods demand remains robust. Nonetheless, the falling shipping prices mean that the pressure on supply chains could be easing in time for the crucial holiday season. This would be good news for holiday shoppers as well as investors.
—
Originally posted on November 10, 2021 – Two Charts That Show Global Supply Chain Issues Could Be Starting to Ease
The views and opinions contained herein are those of Schroders’ investment teams and/or Economics Group, and do not necessarily represent Schroder Investment Management North America Inc.’s house views. These views are subject to change. This information is intended to be for information purposes only and it is not intended as promotional material in any respect.
Disclosure: Schroders
Important Information: This communication is marketing material. The views and opinions contained herein are those of the author(s) on this page, and may not necessarily represent views expressed or reflected in other Schroders communications, strategies or funds. This material is intended to be for information purposes only and is not intended as promotional material in any respect. The material is not intended as an offer or solicitation for the purchase or sale of any financial instrument. It is not intended to provide and should not be relied on for accounting, legal or tax advice, or investment recommendations. Reliance should not be placed on the views and information in this document when taking individual investment and/or strategic decisions. Past performance is not a reliable indicator of future results. The value of an investment can go down as well as up and is not guaranteed. All investments involve risks including the risk of possible loss of principal. Information herein is believed to be reliable but Schroders does not warrant its completeness or accuracy. Some information quoted was obtained from external sources we consider to be reliable. No responsibility can be accepted for errors of fact obtained from third parties, and this data may change with market conditions. This does not exclude any duty or liability that Schroders has to its customers under any regulatory system. Regions/ sectors shown for illustrative purposes only and should not be viewed as a recommendation to buy/sell. The opinions in this material include some forecasted views. We believe we are basing our expectations and beliefs on reasonable assumptions within the bounds of what we currently know. However, there is no guarantee than any forecasts or opinions will be realized. These views and opinions may change. Schroder Investment Management North America Inc. is a SEC registered adviser and indirect wholly owned subsidiary of Schroders plc providing asset management products and services to clients in the US and Canada. Interactive Brokers and Schroders are not affiliated entities. Further information about Schroders can be found at www.schroders.com/us. Schroder Investment Management North America Inc. 7 Bryant Park, New York, NY, 10018-3706, (212) 641-3800.
Disclosure: Interactive Brokers
Information posted on IBKR Campus that is provided by third-parties does NOT constitute a recommendation that you should contract for the services of that third party. Third-party participants who contribute to IBKR Campus are independent of Interactive Brokers and Interactive Brokers does not make any representations or warranties concerning the services offered, their past or future performance, or the accuracy of the information provided by the third party. Past performance is no guarantee of future results.
This material is from Schroders and is being posted with its permission. The views expressed in this material are solely those of the author and/or Schroders and Interactive Brokers is not endorsing or recommending any investment or trading discussed in the material. This material is not and should not be construed as an offer to buy or sell any security. It should not be construed as research or investment advice or a recommendation to buy, sell or hold any security or commodity. This material does not and is not intended to take into account the particular financial conditions, investment objectives or requirements of individual customers. Before acting on this material, you should consider whether it is suitable for your particular circumstances and, as necessary, seek professional advice.
Disclosure: Futures Trading
Futures are not suitable for all investors. The amount you may lose may be greater than your initial investment. Before trading futures, please read the CFTC Risk Disclosure. A copy and additional information are available at ibkr.com.


