


I’m envious when someone makes my point more concisely and effectively than I have. Over the past few weeks, I’ve been trying to resolve the seeming disconnect between the lackluster fundamentals – certainly the run of higher than expected inflation statistics and soaring bond yields — with equities’ resilience. Then a respected analyst posted a succinct tweet yesterday which noted that the “bearish case here is almost all based on fundamental/economic stuff [while the] bullish case is almost all based on technical/market factors.” That sums up the market mood rather well, but leaves us with the very important question about who is correct.
Technicals vs. fundamentals is one of the existential questions that have befuddled investors for ages. For the most part, they generally agree. Rising markets are usually the result of strong earnings and/or accommodative monetary policies. When earnings streams are threatened, either by a weaker economy or when higher rates depress their present value, equity markets tend to fall. Determining how those factors on either a macro or a company-specific level is a difficult and nuanced task, and it is hardly uncommon for analysts to disagree – sometimes wildly. While these fundamentals usually drive valuations in the long-term, stock prices in the short-term can diverge substantially from what fundamentals might seem to apply.
Although there are many who are dismissive about the value of technical analysis, I have found it an invaluable tool for trading. I liken technical analysis to a road map. We have a general idea of where we might be heading, but don’t always know what sort of guideposts to look for. Tools like moving averages, trendlines, and support and resistance levels often provide the route.
We can see how the technical provided solid support for the S&P 500 (SPX) over recent sessions. The index found support first at its 50-day moving average, then its 200-day before bouncing once again:
SPX Daily Candles Since November 30, 2022 with 50-day (yellow) and 200-day (green) Moving Averages
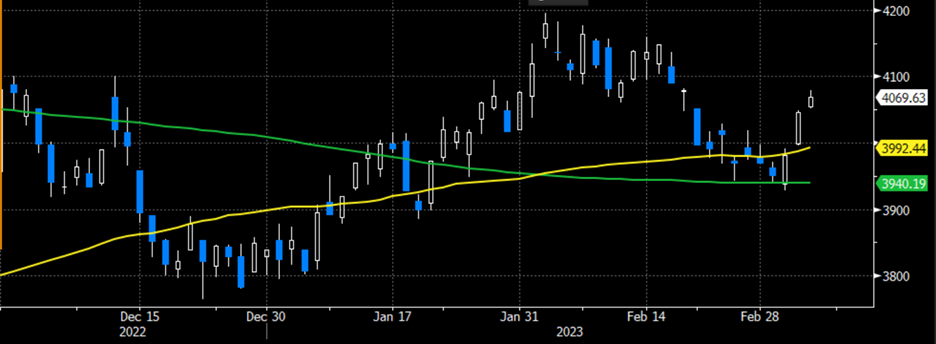
Source: Bloomberg
Meanwhile, we can see that on a simplistic valuation basis, the Price/Earnings ratio for SPX does not appear all too elevated based upon recent history. The difficulty with using that measure is that multiples tend to rise during periods of monetary expansion but we haven’t had a period of sustained monetary contraction – like we see now – since before 2008. Even so, SPX’ P/E is not particularly elevated.
20-Year Monthly Data, SPX (white), SPX P/E (green), SPX Price/EBITDA (yellow)
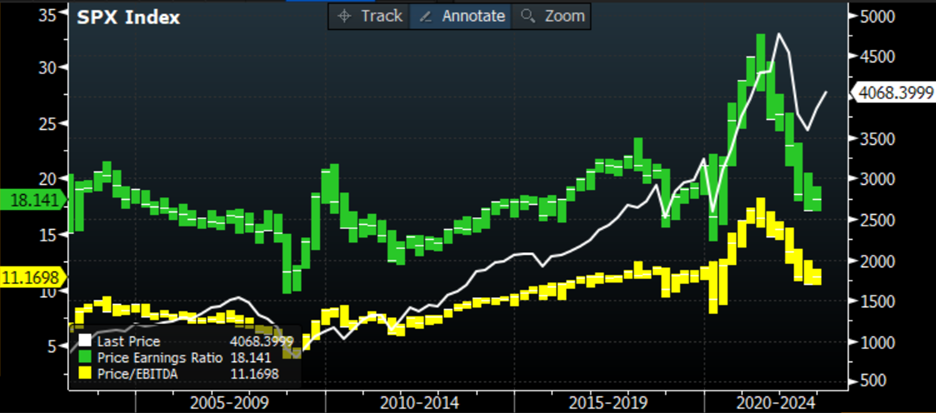
Source: Bloomberg
The difference occurs when we use Price/EBITDA. I prefer that measure because it is a more basic measure of a company’s profitability. Companies have become increasingly aggressive at moving inconvenient expenses off their final bottom lines, raising those final values. Consider all the companies that prefer to use pro-forma or adjusted EPS rather than GAAP measures. On a Price/EBITDA basis, we have about 20% downside until the levels seen during the last tightening cycle but prior to the Global Financial Crisis. Of course, if the world’s central banks overtighten, valuations could shrink even further.
Bottom line: the technical are doing a solid job of guiding us through the recent momentum-driven rally that we have seen since the start of the year. The larger question is whether they are guiding us to the proper ultimate destination.
Disclosure: Interactive Brokers
The analysis in this material is provided for information only and is not and should not be construed as an offer to sell or the solicitation of an offer to buy any security. To the extent that this material discusses general market activity, industry or sector trends or other broad-based economic or political conditions, it should not be construed as research or investment advice. To the extent that it includes references to specific securities, commodities, currencies, or other instruments, those references do not constitute a recommendation by IBKR to buy, sell or hold such investments. This material does not and is not intended to take into account the particular financial conditions, investment objectives or requirements of individual customers. Before acting on this material, you should consider whether it is suitable for your particular circumstances and, as necessary, seek professional advice.
The views and opinions expressed herein are those of the author and do not necessarily reflect the views of Interactive Brokers, its affiliates, or its employees.
