


GME Implied Volatility Chart Story
Given the extraordinary recent volatility in GME stock, we decided to examine the implied volatility (IV) charts to understand how option traders are reacting and perceiving forward volatility estimates.
Historical Chart Analysis
As illustrated by the three-year implied volatility chart, GME’s IV has surged to its highest point at 337. This sharp rise indicates that traders are currently pricing in significant future volatility over the next 30 days. The recent spike in IV suggests that the market expects this heightened volatility to persist in the near term.
Volume and IV Spike
The IV jump was accompanied by a substantial increase in trading volume, as evidenced by the volume bars on the chart. This surge in volume may indicate significant option positions being taken, which could require rebalancing and, in turn, contribute to further stock volatility.
Stock Volatility Comparison

To provide a comprehensive analysis, we overlay the actual 20-day moving average stock volatility on the IV chart. The stock volatility, represented by the purple line, has indeed increased but remains below the implied volatility line. Currently, the 20-day historical volatility stands at 197, while the implied volatility is at 337.
This discrepancy suggests that options traders are anticipating even greater future volatility than what has been observed historically.
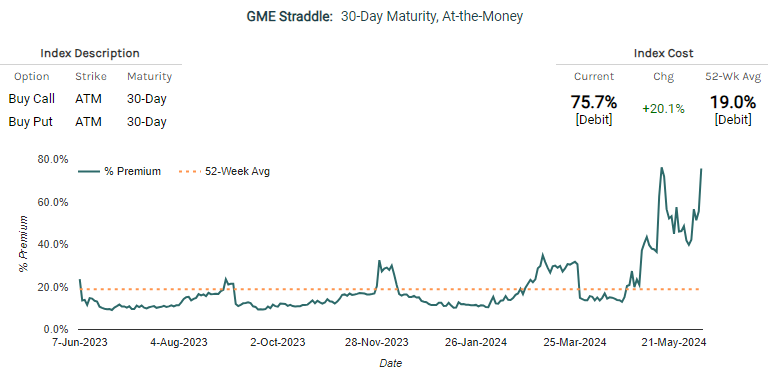
Implications for Straddle Prices
Implied volatility also has significant implications for the pricing of straddles. By examining our straddle benchmark price, we can estimate how much the stock might move in the next 30 days. The benchmark currently suggests a potential 75% move, which is remarkably higher than its average of 19% over the past year.
This dramatic increase underscores the heightened expectations of volatility among traders.
Conclusion
In conclusion, the implied volatility chart reveals that traders believe the volatility in GME is far from over. The current IV levels suggest that significant movements in the stock may continue.
The market’s anticipation of sustained volatility, as reflected in the elevated straddle prices and trading volume, indicates that GME’s tumultuous ride is likely to persist.
—
Originally Posted June 7, 2024 – GME’s Roller Coaster: What Implied Volatility Charts Reveal
NOTE: Stock and option trading involves risk that may not be suitable for all investors. Examples contained within this report are simulated And may have limitations. Average returns and occurrences are calculated from snapshots of market mid-point prices And were Not actually executed, so they do not reflect actual trades, fees, or execution costs. This report is for informational purposes only, and is not intended to be a recommendation to buy or sell any security. Neither Market Chameleon nor any other party makes warranties regarding results from its usage. Past performance does not guarantee future results. Please consult a financial advisor before executing any trades. You can read more about option risks and characteristics at theocc.com.
The information is provided for informational purposes only and should not be construed as investment advice. All stock price information is provided and transmitted as received from independent third-party data sources. The Information should only be used as a starting point for doing additional independent research in order to allow you to form your own opinion regarding investments and trading strategies. The Company does not guarantee the accuracy, completeness or timeliness of the Information.
Disclosure: Market Chameleon
The information provided on MarketChameleon is for educational and informational purposes only. It should not be considered as financial or investment advice. Trading and investing in financial markets involve risks, and individuals should carefully consider their own financial situation and consult with a professional advisor before making any investment decisions. MarketChameleon does not guarantee the accuracy, completeness, or reliability of the information provided, and users acknowledge that any reliance on such information is at their own risk. MarketChameleon is not responsible for any losses or damages resulting from the use of the platform or the information provided therein. The 7-day free trial is offered for evaluation purposes only, and users are under no obligation to continue using the service after the trial period.
Disclosure: Interactive Brokers
Information posted on IBKR Campus that is provided by third-parties does NOT constitute a recommendation that you should contract for the services of that third party. Third-party participants who contribute to IBKR Campus are independent of Interactive Brokers and Interactive Brokers does not make any representations or warranties concerning the services offered, their past or future performance, or the accuracy of the information provided by the third party. Past performance is no guarantee of future results.
This material is from Market Chameleon and is being posted with its permission. The views expressed in this material are solely those of the author and/or Market Chameleon and Interactive Brokers is not endorsing or recommending any investment or trading discussed in the material. This material is not and should not be construed as an offer to buy or sell any security. It should not be construed as research or investment advice or a recommendation to buy, sell or hold any security or commodity. This material does not and is not intended to take into account the particular financial conditions, investment objectives or requirements of individual customers. Before acting on this material, you should consider whether it is suitable for your particular circumstances and, as necessary, seek professional advice.
Disclosure: Options (with multiple legs)
Options involve risk and are not suitable for all investors. For information on the uses and risks of options, you can obtain a copy of the Options Clearing Corporation risk disclosure document titled Characteristics and Risks of Standardized Options by clicking the link below. Multiple leg strategies, including spreads, will incur multiple transaction costs. "Characteristics and Risks of Standardized Options"


Join The Conversation
If you have a general question, it may already be covered in our FAQs. If you have an account-specific question or concern, please reach out to Client Services.