


Major stock indices are flirting with record highs with two potential Covid-19 vaccines on the horizon. That seems like the perfect setup for continued stock market strength. Bullish markets that trend higher for long periods of time are usually accompanied by low levels of the CBOE Volatility Index (VIX). While VIX is trading well below the peak levels that we saw earlier this year – or even earlier this month – at 22.14 it is still above historical norms. We have to ask why?
The chart below is a 30 year monthly candle chart of VIX. We can see that VIX is well below its peak and also above longer-term moving averages. One frequently hears that VIX has a long-term trend in the high teens, and this is borne out by the graph. The 60 month moving average (yellow line) of 17.37 equates to a 5 year period – a long time frame for a trading vehicle. Anyone who has been paying attention over the past year knows that markets have been abnormally volatile, and we can see that in the 12 month moving average (magenta) of 28.24. We are essentially splitting that difference with a reading around 22.
Chart: 30 Year Monthly VIX with 12, 36, 60 Month Moving Averages
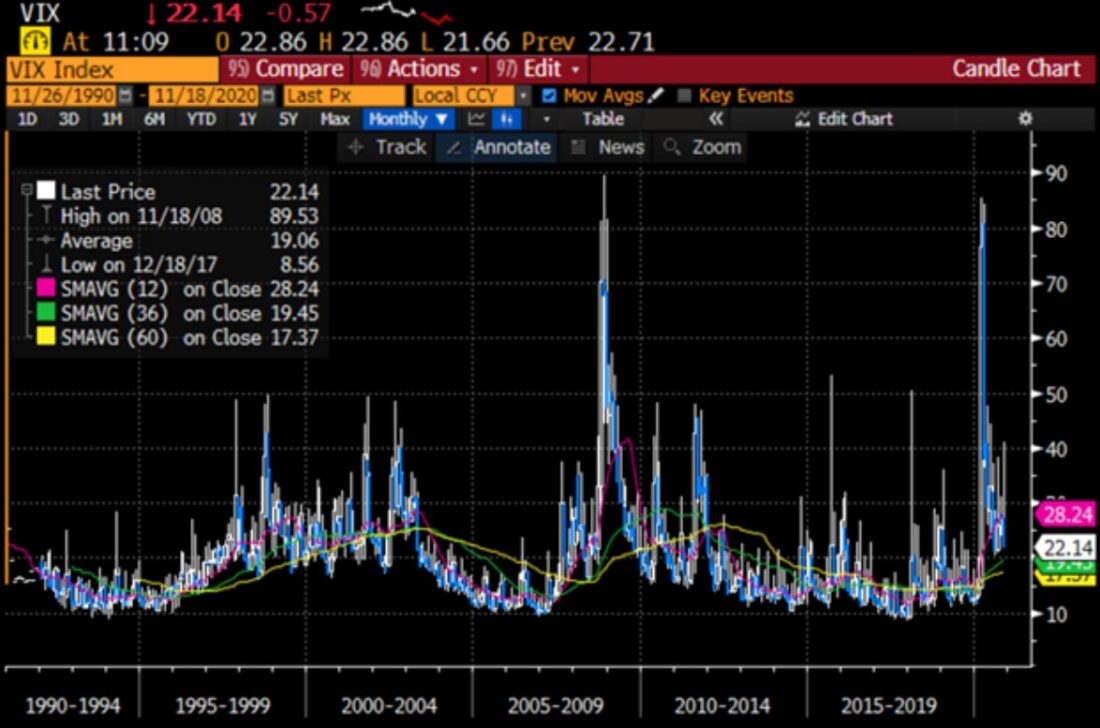
Source: Bloomberg
One would logically expect that a market which is sanguine enough to consort with record highs would see a bright future. For starters, bear in mind that VIX is constructed to give the options market’s best estimate of volatility over the ensuing 30 days. At current levels, VIX implies average daily moves for the S&P 500 Index (SPX) of just under 1% per day (using the “Rule of 16”). The 200 day historical volatility for SPX is currently 23.79, about in line with the current VIX. Yet 20 and 66 day historical volatility readings are both around 15.5, well below VIX. That implies that markets are concerned that volatility could return to the more elevated levels seen earlier this year.
That concern seems more evident when one considers the VIX futures curve, displayed in the graph below. The current curve (orange) rises into the future months. It rises steadily until January, then remains firmly ensconced between 25 and 26. On one hand, the return to an upward sloping curve (“contango”) implies a return to normality in the availability of volatility protection. That is a significant change from the inversions that we saw earlier this year. But if few were truly sanguine, would VIX futures continue to predict volatility well above historical norms?
Chart: Current VIX Futures Curve, Along with Curves from 1 Month and 3 Months Ago
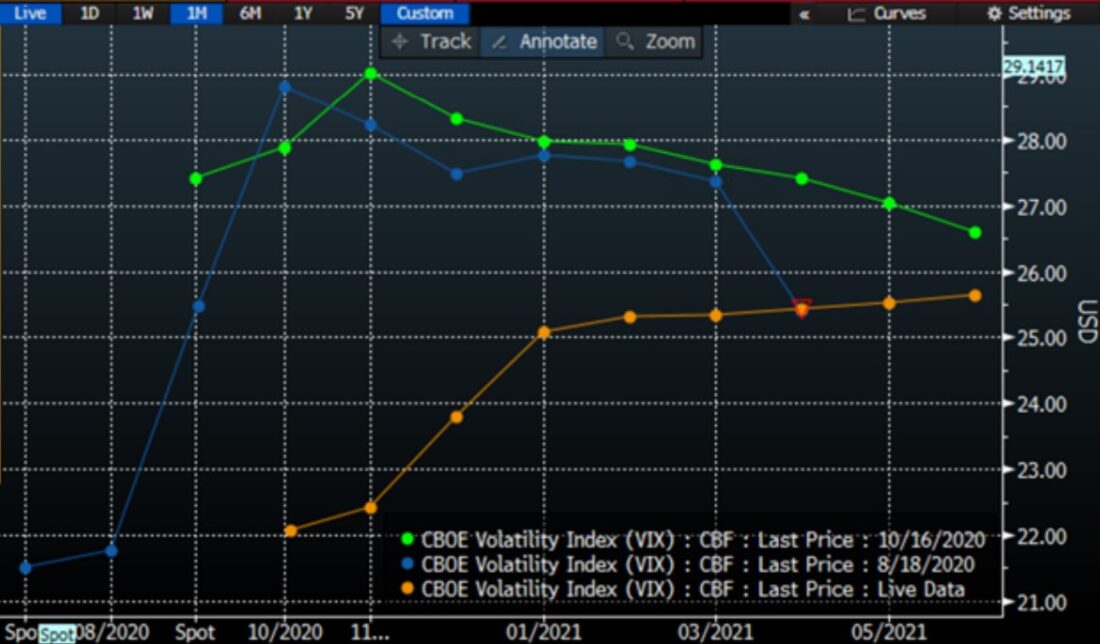
Source: Bloomberg
I believe that the nature of the current market move is somehow to blame. Unlike in previous bull markets, much of the rise has been fueled by options buying in highly capitalized technology shares. We have seen near-record lows in the put/call ratio and record highs in options volume and open interest. All that speculative fervor pushes volatility higher. It is seemingly more benign than when nervous investors clamor for put protection, but buyers of either puts or calls require someone to sell those options. Those sellers raise options prices in the face of demand as it becomes more difficult for them to hedge. Paradoxically, a bullish environment could perpetuate that trend, keeping VIX and other volatility measures at elevated levels.
What could upset this trend? A continuing surge in Covid before vaccines are widely available could dampen economic activity even further. Congressional gridlock makes fiscal stimulus unlikely, keeping the onus on a Federal Reserve that has continually stated that their options are relatively limited without fiscal help. Furthermore, much of the options buying has been coming from individual investors. We noted how much of the rise in individual investing coincided with the receipt of stimulus checks and other measures that reduced personal expenses. However, unless a lame-duck administration once again extends rent and student-loan moratoria, many of those individual investors may find themselves with fewer funds to invest in stocks and their options.
Does that mean that volatility remains high one way or the other? High if money continues to flow into the options market, and high if it sells off if the flows stop or reverse? Perhaps that is what VIX is telling us.
Disclosure: Interactive Brokers
The analysis in this material is provided for information only and is not and should not be construed as an offer to sell or the solicitation of an offer to buy any security. To the extent that this material discusses general market activity, industry or sector trends or other broad-based economic or political conditions, it should not be construed as research or investment advice. To the extent that it includes references to specific securities, commodities, currencies, or other instruments, those references do not constitute a recommendation by IBKR to buy, sell or hold such investments. This material does not and is not intended to take into account the particular financial conditions, investment objectives or requirements of individual customers. Before acting on this material, you should consider whether it is suitable for your particular circumstances and, as necessary, seek professional advice.
The views and opinions expressed herein are those of the author and do not necessarily reflect the views of Interactive Brokers, its affiliates, or its employees.
Disclosure: Options Trading
Options involve risk and are not suitable for all investors. Multiple leg strategies, including spreads, will incur multiple commission charges. For more information read the "Characteristics and Risks of Standardized Options" also known as the options disclosure document (ODD) or visit ibkr.com/occ
Disclosure: Futures Trading
Futures are not suitable for all investors. The amount you may lose may be greater than your initial investment. Before trading futures, please read the CFTC Risk Disclosure. A copy and additional information are available at ibkr.com.
")

