


Much has been made about the relationship between rising rates and falling tech stocks. We addressed the topic yesterday, showing that despite all the relationship between the yield on 10-year US Treasury notes and Apple (AAPL) was not nearly as ironclad as it appeared, using a graph like this:
5 Year Daily Logarithmic Chart, AAPL (orange line, right) vs 10-Year Note Yields (blue line, left)
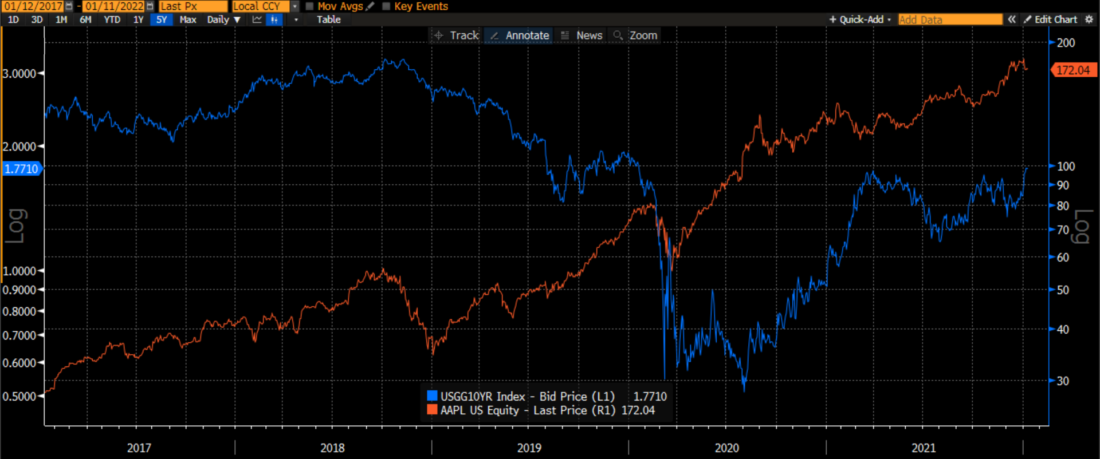
Source: Bloomberg
We used AAPL as a convenient proxy for the NASDAQ 100 Index (NDX), which serves as a proxy for the tech sector as a whole:
5 Year Daily Logarithmic Chart, NDX (white/blue bars, right) vs 10-Year Note Yields (blue line, left)
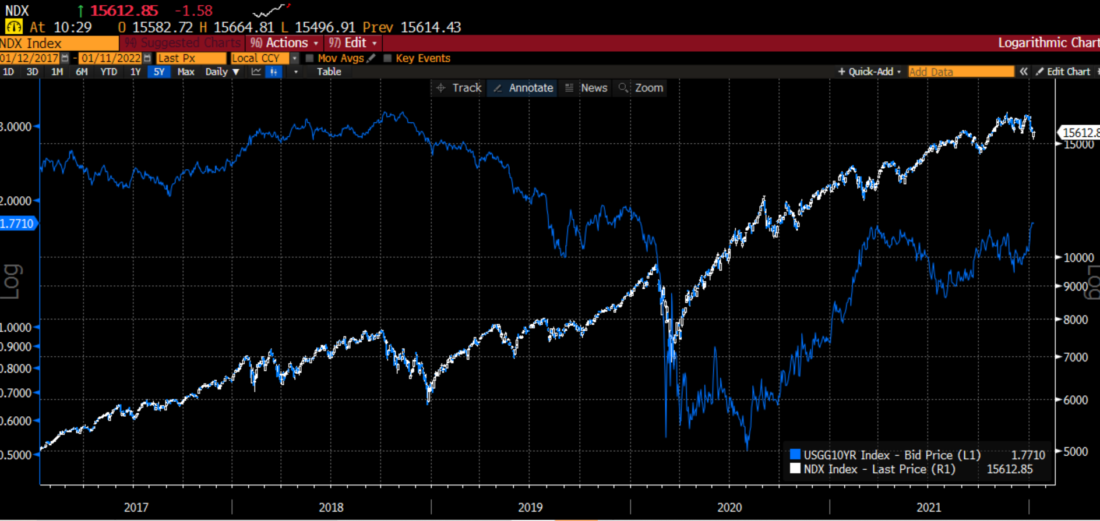
Source: Bloomberg
But I must confess to being a bit naïve with the graphics that I chose. The graph looks quite different when we switch to real yields – the nominal yield on the 10-year note adjusted for CPI inflation – over the recent time frame:
5 Year Daily Chart, NDX (white/blue bars, right) vs 10-Year Real Yields (blue line, left)
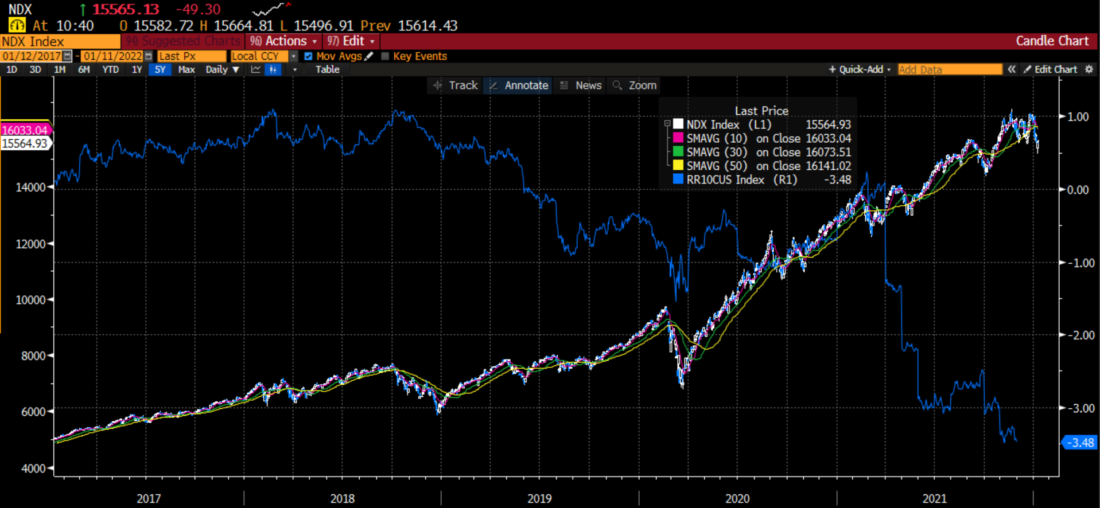
Source: Bloomberg
Indeed, while 10 year nominal rates began to rise in recent months, inflation rose faster. That depressed real interest rates continually toward more negative levels. Yet if we look to the left side of the graph above, we see NDX rising even as long-term rates rose. If we look back over a longer history we see a general relationship between lower real rates and higher levels of NDX:
30 Year Monthly Chart, NDX (white/blue bars, right) vs 10-Year Real Yields (blue line, left)
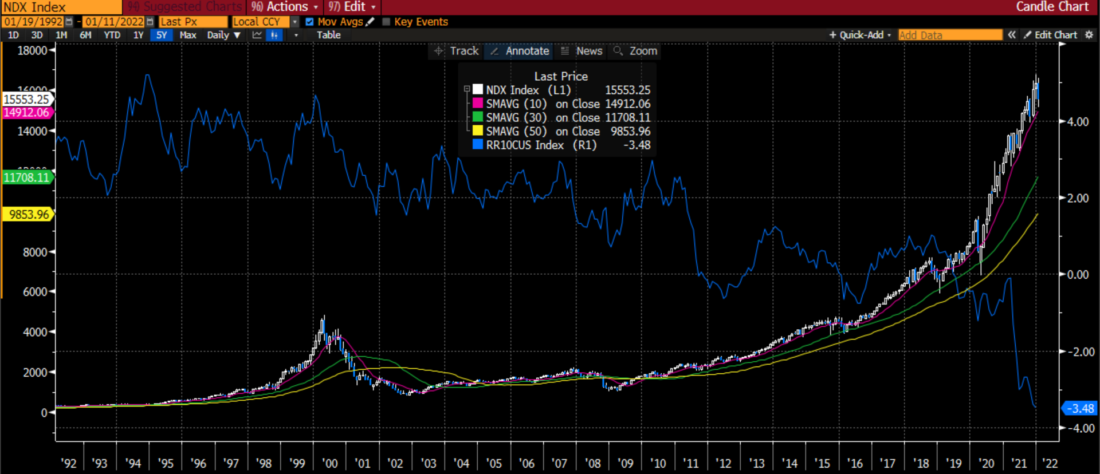
Source: Bloomberg
But pay special attention to the 1997-2001 period, which is commonly thought of as the internet bubble. In that period we saw an almost perfect positive correlation with real rates, not the inverse correlation that is widely observed. While that was indeed a unique time period in market history, I believe that future investors will look back at our current environment as similarly unusual.
Finally, let’s take a look at the correlation between NDX and 10-year real yields. Since we have already established that there was a roughly 5 year period where the correlation would be extraordinarily unusual, we will start the data in 2002:
Correlation Between NDX and 10-Year Real Yields, 20 Years, Monthly Data
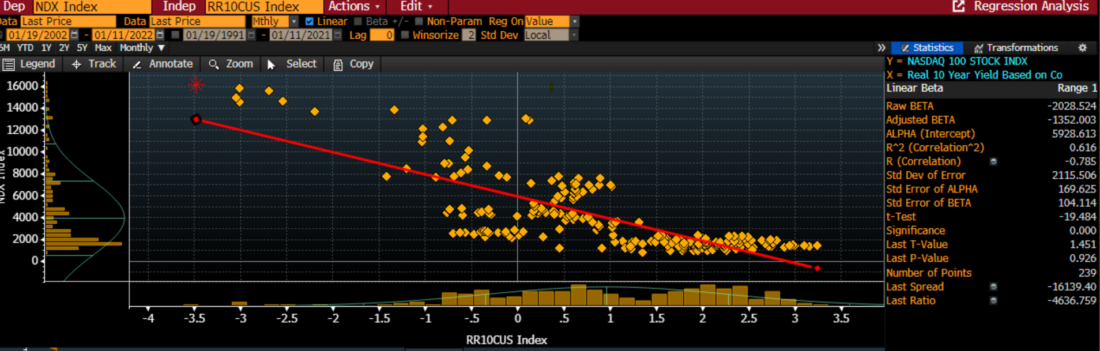
Source: Bloomberg
We see an inverse correlation, as one would expect, and a reasonably linear relationship. Interestingly, the current value is an outlier, implying that NDX has outstripped the historically low real rate level – even before many expect that rate to rise as the Fed tapers its bond purchases. If this relationship holds, the recent volatility in tech shares could persist.
Disclosure: Interactive Brokers
The analysis in this material is provided for information only and is not and should not be construed as an offer to sell or the solicitation of an offer to buy any security. To the extent that this material discusses general market activity, industry or sector trends or other broad-based economic or political conditions, it should not be construed as research or investment advice. To the extent that it includes references to specific securities, commodities, currencies, or other instruments, those references do not constitute a recommendation by IBKR to buy, sell or hold such investments. This material does not and is not intended to take into account the particular financial conditions, investment objectives or requirements of individual customers. Before acting on this material, you should consider whether it is suitable for your particular circumstances and, as necessary, seek professional advice.
The views and opinions expressed herein are those of the author and do not necessarily reflect the views of Interactive Brokers, its affiliates, or its employees.


