


1/ Growth Vs. Value
2/ A Strong Bull Rally Never Discriminates
3/ Technical Setup Growth (SPYG) and Value (SPYV)
4/ Where Do We Find a Bit More of Alpha?
Investopedia is partnering with CMT Association on this newsletter. The contents of this newsletter are for informational and educational purposes only, however, and do not constitute investing advice. The guest authors, which may sell research to investors, and may trade or hold positions in securities mentioned herein do not represent the views of CMT Association or Investopedia. Please consult a financial advisor for investment recommendations and services.
1/ Growth Vs. Value
Equity markets are often divided into growth and value stocks, with growth stocks representing companies poised for rapid expansion, prioritizing reinvestment, while value stocks encompass established firms considered undervalued based on fundamental metrics, often characterized by stable performance and dividend payments.
Growth stocks tend to outperform during economic expansions and low-interest-rate environments. Value stocks tend to outperform during economic contractions and when there’s a shift toward higher interest rates.
2/ A Strong Bull Rally Never Discriminates
However, a strong broad-based bull run never discriminates between the two. Both Growth and Value stocks may move higher during broad market rallies or bull markets. Positive economic conditions, strong corporate earnings, and overall market optimism can simultaneously increase growth and value stocks. On a YTD basis, both Growth and Value space returned respectable returns.
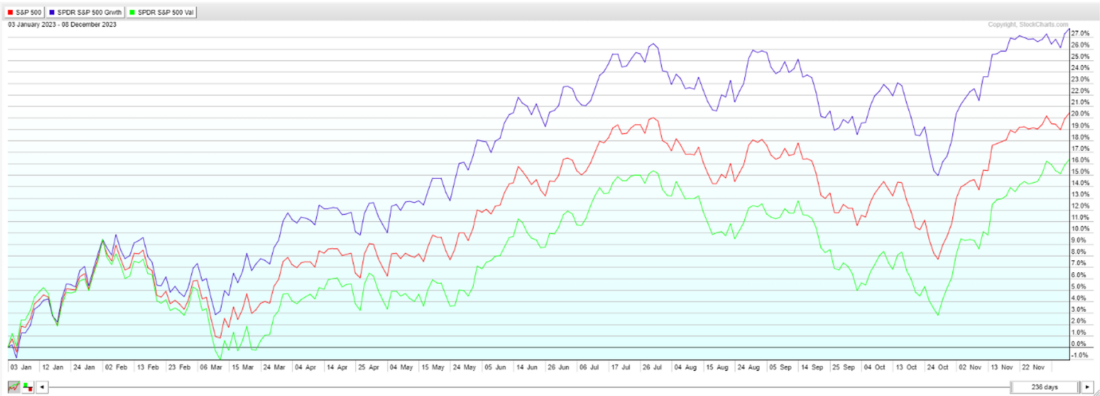
Courtesy of StockCharts.com
We represent the group of Value stocks through SPDR S&P 500 Value ETF (SPYV) and Growth Stocks through SPDR S&P 500 Growth ETF (SPYG). A relative comparison of the Year-to-Date (YTD) performance shows a clear out performance by the Growth ETF as SPYG gained 26.59%. During the same period, the Value ETF (SPYV) returned 14.76%. It not only underperformed Growth (SPYG) but also the broad market index S&P 500 which returned 20.40%.
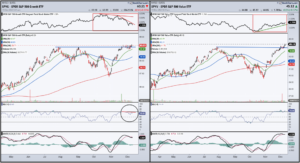
3/ Technical Setup Growth (SPYG) and Value (SPYV)
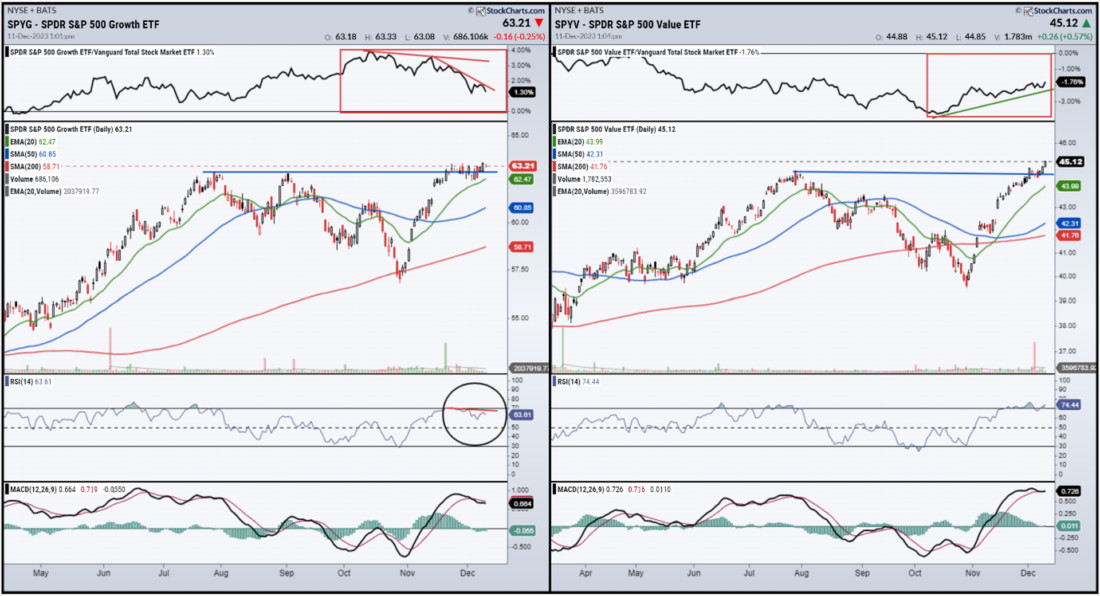
Courtesy of StockCharts.com
If the technical setup of both SPYG and SPYV is examined individually, both the charts look equally buoyant. Both SPYG and SPYV have attempted to take out their major tops and are seen attempting a breakout. However, a closer look reveals a few signs of fatigue with the Growth stocks. In the case of SPYG, RSI is seen negatively diverging with it failing to mark a new high along with the price. Also, the RS line against the broader SPX is in a declining trajectory.
On the other hand, SPYV has also made a breakout; the RS line against the SPX is also seen rising and in a firm uptrend.
4/ Where Do We Find a Bit More Alpha?
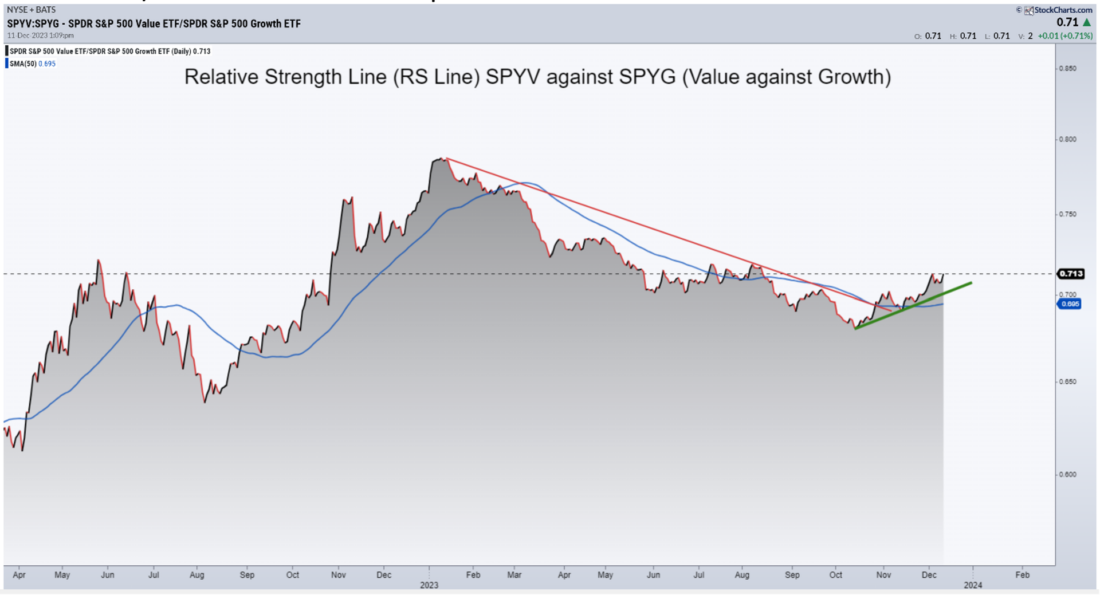
Courtesy of StockCharts.com
The picture gets clearer when we compare one against the other. When we compare Value (SPYV) against Growth (SPYG), the RS line tells us that the Growth stocks relatively outperformed the value stocks for the first ten months of this year. However, over the past few weeks, the RS line of Value against Growth stocks has reversed its trend; it is seen firmly moving higher and has crossed above its 50-period MA.
In a nutshell, if the broad bull run continues, we may see both the pockets, i.e., the Value and Growth stocks rising individually. However, over the coming week, we can fairly expect the Value stocks to generate alpha over the Growth stocks.
—
Originally posted 14th December 2023
Disclosure: Investopedia
Investopedia.com: The comments, opinions and analyses expressed herein are for informational purposes only and should not be considered individual investment advice or recommendations to invest in any security or to adopt any investment strategy. While we believe the information provided herein is reliable, we do not warrant its accuracy or completeness. The views and strategies described on our content may not be suitable for all investors. Because market and economic conditions are subject to rapid change, all comments, opinions and analyses contained within our content are rendered as of the date of the posting and may change without notice. The material is not intended as a complete analysis of every material fact regarding any country, region, market, industry, investment or strategy. This information is intended for US residents only.
Disclosure: Interactive Brokers
Information posted on IBKR Campus that is provided by third-parties does NOT constitute a recommendation that you should contract for the services of that third party. Third-party participants who contribute to IBKR Campus are independent of Interactive Brokers and Interactive Brokers does not make any representations or warranties concerning the services offered, their past or future performance, or the accuracy of the information provided by the third party. Past performance is no guarantee of future results.
This material is from Investopedia and is being posted with its permission. The views expressed in this material are solely those of the author and/or Investopedia and Interactive Brokers is not endorsing or recommending any investment or trading discussed in the material. This material is not and should not be construed as an offer to buy or sell any security. It should not be construed as research or investment advice or a recommendation to buy, sell or hold any security or commodity. This material does not and is not intended to take into account the particular financial conditions, investment objectives or requirements of individual customers. Before acting on this material, you should consider whether it is suitable for your particular circumstances and, as necessary, seek professional advice.
Disclosure: ETFs
Any discussion or mention of an ETF is not to be construed as recommendation, promotion or solicitation. All investors should review and consider associated investment risks, charges and expenses of the investment company or fund prior to investing. Before acting on this material, you should consider whether it is suitable for your particular circumstances and, as necessary, seek professional advice.


Join The Conversation
If you have a general question, it may already be covered in our FAQs. If you have an account-specific question or concern, please reach out to Client Services.