


Once upon a time, there was everybody’s favourite finance tool in a town – Capital Asset Pricing Model, which was liked and used by nearly everyone. But a few decades ago, it went out of fashion. Easier accessibility of cheap finance databases allowed a lot of researchers to dig deeper into those data. They uncovered a tremendous amount of evidence for a lot of market anomalies not consistent with CAPM. A new research paper written by Park and Wang shows that CAPM is maybe not completely useless. The rise of automated trading causes individual stocks’ returns to align more closely with the market. Intraday correlation in the equity market is rising, and so is the fraction of firms’ returns that are explained by market returns …
Authors: Park, Wang
Title: Did Trading Bots Resurrect the CAPM?
Link: https://papers.ssrn.com/sol3/papers.cfm?abstract_id=3515635
Abstract:
We document a significant, up to 10-fold increase in the intra-day correlation of firm-specific and market returns over the last decade. This surge in the intra-day correlation of returns coincided with the advent of electronic, automated trading in U.S. markets. Using changes to the S&P500 index, we establish evidence of a causal relationship. When firms are included in this major index, they enter the radar of high frequency arbitrageurs and market making algorithmic traders. These trading robots, who monitor prices in major securities closely and continuously, increase their quoting activities significantly and cause individual stocks’ returns to align more closely with the market.
Notable quotations from the academic research paper:
“Over the last two decades, individual stocks’ intra-day returns and market returns have become increasingly aligned, a new stylized fact that we document in this paper. This increase happened alongside the well-documented rise in algorithmic and autonomous trading. There is a broad consensus in the market microstructure literature that the digitization and automation of trading has lowered trading costs and removed frictions. It is, however, an open question whether the rise in “robotic” or “bot” trading has broader implications for stock returns, costs of capital, and investment. To address this question, we study whether there is a causal relationship, that is, whether algorithmic, autonomous electronic trading causes the substantially stronger intra-day alignment of returns across securities. Such a relationship would be a pre-requiste for the broader implications on costs of capital.
It is challenging to identify this relationship with the standard, stock by stock micro-structure measures because asset pricing measures intrinsically require a multi-asset view. In this paper, we assess whether “bot trading” leads to changes in the alignment of stock returns across securities by studying the relationship of bot trading and the goodness-of-fit of a standard market model estimated on high frequency, intra-day data. Our goal is to assess how the fraction of realized returns that are explained by market returns relates to the extent of bot trading. Motivated by Roll (1988) who, in his 1988 presidential address, discussed the extent to which security returns are captured by the R2 of an OLS regression of stock returns on the returns of the market portfolio, we focus on a related, intra-day measure. Namely, we estimate OLS regressions of intra-day stock returns on intra-day market returns, record the goodness-of-fit in the form of the regression’s R2 (and the coefficients) and perform a panel regression analysis with the R2s as the variable of interest.
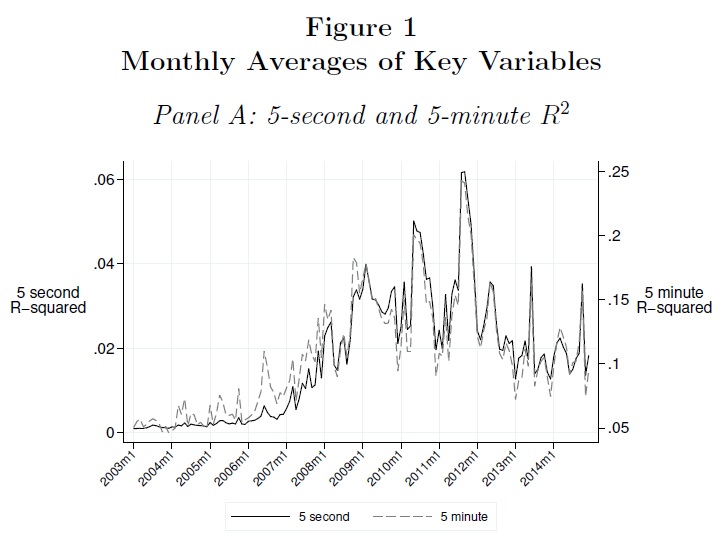
We proceed by estimating, for each security in the NYSE TAQ database and day between 2003 and 2014, a standard market model for intra-day 5-second and 5-minute mid-quote returns. We use the returns for the Russell 2000 index represented by the exchange traded fund IWM as our high-frequency proxy for the market. Our measure of interest is the R2 of these regressions, and we find some striking stylized facts, which can be easily gleaned from Figure 1. From 2003 to early 2007, the R2 is very small and “flat”; even for the 1,000 largest firms the average R2 is below 1%. From 2007 to 2010, however, the R2 increases substantially, from 1% to, on average, 10% for the 1,000 largest firms and it stays at high levels throughout the remainder of the sample. There is no indication that the higher R2 is the result of changes in systematic risk; rather, it appears that intra-day returns become more precisely aligned.
Second, using changes to index compositions, we provide evidence of a causal relationship between the activities of bot trading and the return correlation. Arguably, index membership is arbitrary, occurs only on paper, has no impact on the operation of a firm, and, therefore, return co-movements should not be affected by index inclusion or exclusion. As firms get included in an index, they enter the radar of high frequency traders who closely monitor prices in major securities on an ongoing basis. Their monitoring manifests itself in quoting activities that, in turn, cause individual stocks’ returns to align more closely with the market. Although our work does not fall into standard asset pricing, we believe that we identify an important channel for the impact of market microstructure changes (through the advent of bot trading) on asset pricing.
Third, we provide a methodological innovation by applying new tools from the machine learning literature that help lend further credibility to our analysis and that provide a roadmap for future applications.”
Visit Quantpedia for additional information on this academic paper: https://quantpedia.com/did-automated-trading-resurrect-the-capm/
Disclosure: Interactive Brokers
Information posted on IBKR Campus that is provided by third-parties does NOT constitute a recommendation that you should contract for the services of that third party. Third-party participants who contribute to IBKR Campus are independent of Interactive Brokers and Interactive Brokers does not make any representations or warranties concerning the services offered, their past or future performance, or the accuracy of the information provided by the third party. Past performance is no guarantee of future results.
This material is from Quantpedia and is being posted with its permission. The views expressed in this material are solely those of the author and/or Quantpedia and Interactive Brokers is not endorsing or recommending any investment or trading discussed in the material. This material is not and should not be construed as an offer to buy or sell any security. It should not be construed as research or investment advice or a recommendation to buy, sell or hold any security or commodity. This material does not and is not intended to take into account the particular financial conditions, investment objectives or requirements of individual customers. Before acting on this material, you should consider whether it is suitable for your particular circumstances and, as necessary, seek professional advice.