


The article “ESG Performance Breakdown by E, S, and G” first appeared on Alpha Architect Blog.
Deconstructing ESG Ratings Performance: Risk and Return
for E, S, and G by Time Horizon, Sector, and Weighting
- Guido Giese, Zoltán Nagy, and Linda-Eling Lee
- Journal of Portfolio Management
- A version of this paper can be found here
- Want to read our summaries of academic finance papers? Check out our Academic Research Insight category
What are the research questions?
The relationship among ESG ratings from third-party providers has historically produced conflicting results. Differences in sourced information and weighting schemes have produced low correlations between ratings and as a result, have handicapped the efforts to understand the relationship between ESG ratings and performance. Consequently, the credibility and willingness to use and invest utilizing ESG scores have been undermined for many investors. The authors of this article develop a “pillar” score approach that provides insight into three key economic channels related to ESG pillars, their components, and how they are combined. The analysis is then applied to the MSCI ESG rating methodology. The risk/return levels of individual E, S, and G pillar scores as well as the key issues related to the pillar scores are investigated. If you are so inclined to dig a bit deeper the authors have access to a video and a blog on the paper here.
- What are the economic transmission channels hypothesized in the paper?
- What are the key issues associated with each pillar
- Are they independent issues?
- Are the E, S, and G pillars related to financial performance?
- What about stock price performance? How do the pillars perform?
What are the Academic Insights?
- THERE ARE THREE:
- Cashflow channel: Firms with high (MSCI) ESG ratings are more profitable, with more stable earnings, and have higher dividend yields. The economic rationale is that better business practices (attracting talent, better management of innovation, incentives for management, and promoting customer satisfaction) are linked to higher ESG factors.
- Unsystematic or idiosyncratic risk channel: Firms with higher MSCI ESG ratings have lower drawdowns unrelated to size and industry. The rationale is that firms with higher ESG ratings are better able to manage and diminish firm-specific risk.
- Valuation channel: High ESG rated firms have exhibited lower systematic risk, lower costs of capital, and consequently higher valuations. The rationale is that firms with high ESG ratings are more resilient to changing market and regulatory environments.
- KEY ISSUES DEFINED:
- The Environmental pillar consists of Climate Change 1; plus Pollution and Waste 2; plus Environmental Opportunities 3.
- The Social pillar consists of Human Capital 4; plus Product Liability 5; plus Stakeholder Opposition 6; plus Social Opportunities 7.
- The Governance pillar consists of Corporate Governance 8; and Corporate Behavior 9.
- YES. The key issues appear to measure different factors with relatively low average correlations in the range of -.023 to +.25. The E pillar was the exception with the highest correlation. This result is likely due to the positive relationship between carbon emissions, water stress, and toxic emissions all driven by exposure to energy, mining, and utility sectors. Firms in those sectors tend to manage operational and environmental risks with similar systems and approaches. Overall, average correlations were relatively low, with the highest average level (0.25) found within the E pillar. Key issues under the E and S pillars had average correlations of 0.13; E and G issues at -.023; and S and G issues at -.014. There is not much overlap in the information conveyed by each pillar.
- YES. As noted, each pillar score is based on different sets of key issues which are weighted and used to construct E, S, G, and the overall ESG rating. The question arises as to how the 3 transmission channels performed across the key issues. The analysis shows that the firm-specific/idiosyncratic channel exhibited the most significant results across the 11 key issues tested.
- The G pillar and associated key issues performed best across all 3 channels. For high G-scoring firms, profitability was higher and specific risk and systematic risk lower than firms with low G-scoring firms.
- For the S pillar, health and safety exhibited significant empirical results. At the key issue level, there were significant differences within a pillar for each sector. As noted, health care and energy scored high on the E pillar.
- However, for energy, the E-score was a function of carbon emission, biodiversity, and land use, toxic emissions, and waste, while carbon emissions were the single key issue for health care. The underlying issues differed, even though each sector scored high on the E pillar. Continuing along that line of discussion, the S pillar was dominant in energy and utilities, where the key underlying issues were worker safety or labor relations, perhaps evidenced in a tangible event such as an “accident” or another incident with shorter-term effects.
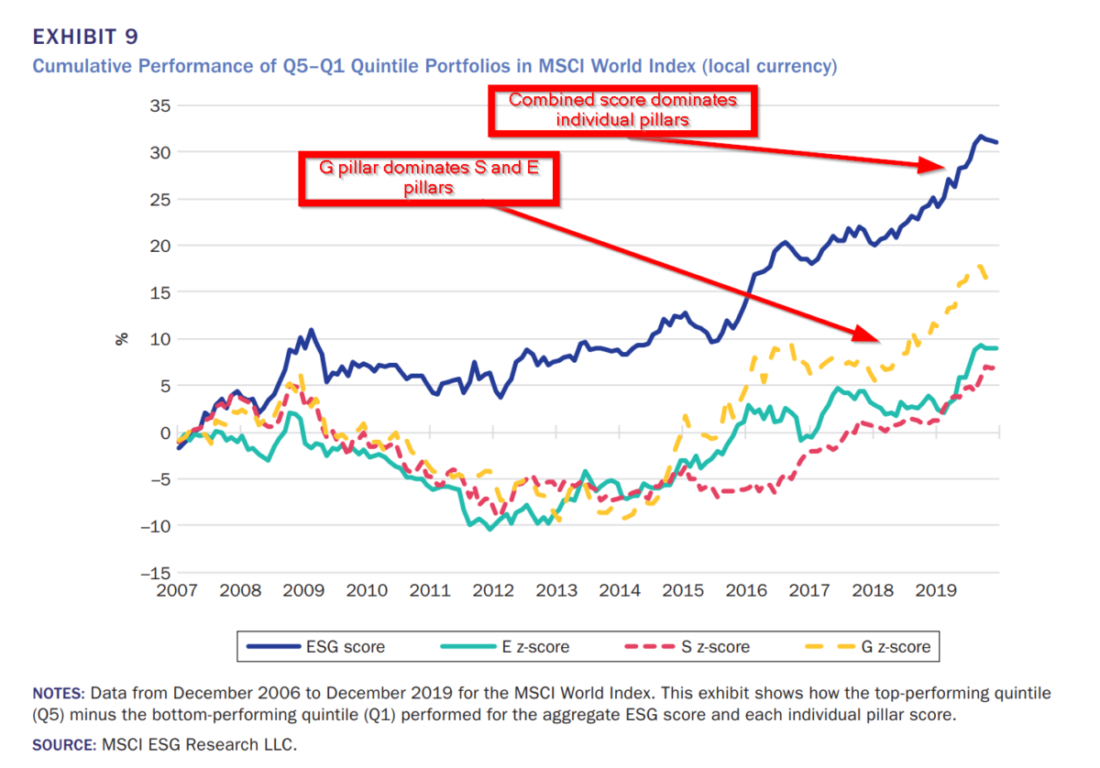
- The stock price performance is presented in Exhibit 9 below. For a majority of the period studied, the G pillar dominated the other two. However, the aggregated ESG score was superior overall. Not very surprising, although the dominance of the G pillar and its associated issues is an interesting and unexpected result.
Why does it matter?
The contribution of this work lies in the documentation of the relative significance of the issues that underlie a combined ESG rating. Although the study is confined to the MSCI ESG rating process, it provides much-needed insight into the theory of how the ESG “factor” is captured. Practically speaking, the analysis provides fodder for integrating ESG factors, pillars, and key issues into stock selection and/or portfolio construction. Of course, ESG investing necessarily imposes constraints on the investment opportunity set. All else equal, ESG investors should not expect to earn excess returns and must consider what factor exposures may lie beneath the surface. In short, always investors should ensure they understand what they own and why. This paper contributes to this discussion.
The most important chart from the paper
The results are hypothetical results and are NOT an indicator of future results and do NOT represent returns that any investor actually attained. Indexes are unmanaged and do not reflect management or trading fees, and one cannot invest directly in an index.
Abstract
There are many ways to construct a company’s environmental, social, and governance (ESG) score or rating, involving different combinations of financial and nonfinancial inputs. Determining the most influential criteria for firm performance may be overlooked in the rush to “do some ESG.” In this study, the authors deconstruct ESG ratings performance at the E, S, and G pillar levels and use the most common key issues indicators that underlie ESG
scores. They find that the time horizon used has an important bearing on the indicators’ significance. In the short term, they find that governance is the dominant pillar because it strongly reflects event risks, such as fraud. In the long term, however, environmental and social indicators became more important because issues such as carbon emissions tended to be more cumulative, presenting erosion risks to long-term performance. The authors also find that a more balanced and industry-specific weighting of E, S, and G issues showed better long-term relevance than the individual pillar indicators alone.
Notes:
- Climate Change = carbon emissions, product carbon footprint, financing environmental impact, climate change vulnerability; plus Natural Capital
Natural Capital = water stress, biodiversity, and land use, raw material sourcing ↩ - Pollution and Waste = toxic emissions and waste, packaging material and waste, electronic waste ↩
- Environmental Opportunities = in clean, green building, and renewable energy ↩
- Human Capital = labor management, health and safety, human capital development, supply chain labor standards ↩
- Product Liability = product safety and quality, chemical safety, financial product safety, privacy and data security, responsible investment ↩
- Stakeholder Opposition = controversial sourcing ↩
- Social Opportunities = access to communication, access to finance and health care, opportunities in nutrition and health ↩
- Corporate Governance = board, pay, ownership, accounting ↩
- Corporate Behavior = business ethics, anti-competitive practices, corruption and instability, financial system instability, and tax transparency ↩
The results are hypothetical results and are NOT an indicator of future results and do NOT represent returns that any investor actually attained. Indexes are unmanaged and do not reflect management or trading fees, and one cannot invest directly in an index.
Disclosure: Alpha Architect
The views and opinions expressed herein are those of the author and do not necessarily reflect the views of Alpha Architect, its affiliates or its employees. Our full disclosures are available here. Definitions of common statistics used in our analysis are available here (towards the bottom).
This site provides NO information on our value ETFs or our momentum ETFs. Please refer to this site.
Disclosure: Interactive Brokers
Information posted on IBKR Campus that is provided by third-parties does NOT constitute a recommendation that you should contract for the services of that third party. Third-party participants who contribute to IBKR Campus are independent of Interactive Brokers and Interactive Brokers does not make any representations or warranties concerning the services offered, their past or future performance, or the accuracy of the information provided by the third party. Past performance is no guarantee of future results.
This material is from Alpha Architect and is being posted with its permission. The views expressed in this material are solely those of the author and/or Alpha Architect and Interactive Brokers is not endorsing or recommending any investment or trading discussed in the material. This material is not and should not be construed as an offer to buy or sell any security. It should not be construed as research or investment advice or a recommendation to buy, sell or hold any security or commodity. This material does not and is not intended to take into account the particular financial conditions, investment objectives or requirements of individual customers. Before acting on this material, you should consider whether it is suitable for your particular circumstances and, as necessary, seek professional advice.