


In the previous part, Lamarcus discussed importing Python libraries numpy as np
and pandas as pd. Follow the series with today’s article, which will focus on how to build a heatmap.
Now that we have our libraries, let’s get our data.
#setting start and end dates
start=’2014-01-01′
end=’2916-01-01′
#importing Walmart and Target using pandas datareader
wmt=pdr.get_data_yahoo(‘WMT’,start,end)
tgt=pdr.get_data_yahoo(‘TGT’,start,end)
Before testing our two stocks for cointegration, let’s take a look at their performance over the period. We’ll create a plot of Walmart* and Target*.
#Creating a figure to plot on
plt.figure(figsize=(10,8))
#Creating WMT and TGT plots
plt.plot(wmt[“Close”],label=’Walmart’)
plt.plot(tgt[‘Close’],label=’Target’)
plt.title(‘Walmart and Target Over 2014-2016’)
plt.legend(loc=0)
plt.show()
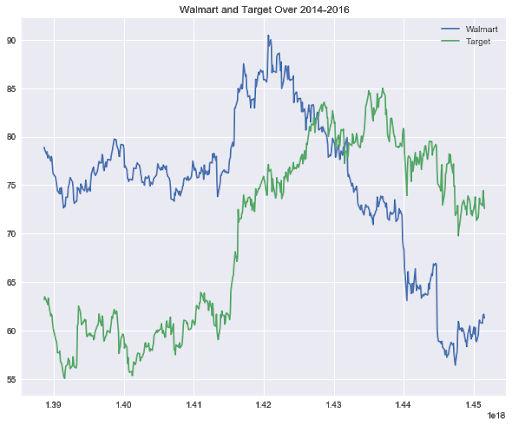
In the above plot, we can see a slight correlation at the beginning of 2014. But this doesn’t really give us a clear idea of the relationship between Walmart and Target. To get a definitive idea of the relationship between the two stocks, we’ll create a correlation heat-map.
To begin creating our correlation heatmap, we must first place Walmart* and Target* prices in the same dataframe. Let’s create a new dataframe for our stocks.
#initializing newDF as a pandas dataframe
newDF=pd.DataFrame()
#adding WMT closing prices as a column to the newDF
newDF[‘WMT’]=wmt[‘Close’]
#adding TGT closing prices as a column to the newDF
newDF[‘TGT’]=tgt[‘Close’]
Now that we have created a new dataframe to hold our Walmart and Target stock prices, let’s take a look at it.
newDF.head()
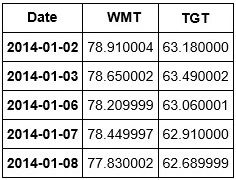
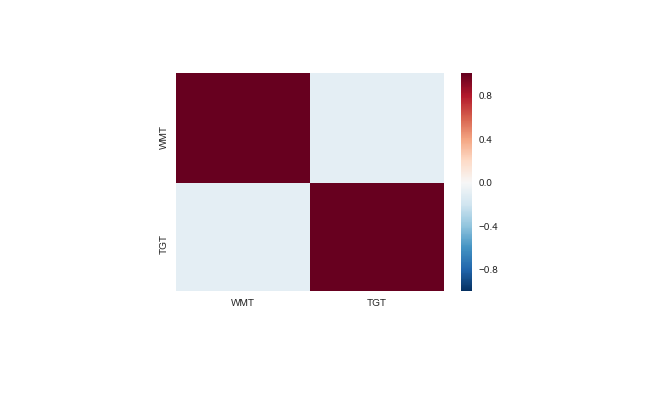
We can see that we have the prices of both our stocks in one place. We are now ready to create a correlation heatmap of our stocks. To this, we will use Python’s Seaborn library. Recall that we imported Seaborn earlier as sns.
#using seaborn as sns to create a correlation heatmap of WMT and TGT
sns.heatmap(newDF.corr())
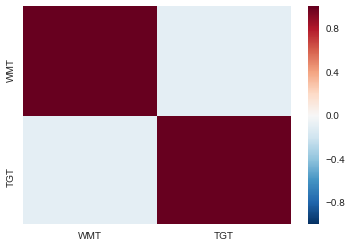
In the above plot, we called the corr() method on our newDF and passed it into Seaborn’s heatmap object. From this visualization, we can see that our two stocks are not that correlated. Let’s create a final visualization to asses this relationship. We’ll use a scatter plot for this.
*Any trading symbols displayed are for illustrative purposes only and are not intended to portray recommendations.
Disclaimer: All investments and trading in the stock market involve risk. Any decisions to place trades in the financial markets, including trading in stock or options or other financial instruments is a personal decision that should only be made after thorough research, including a personal risk and financial assessment and the engagement of professional assistance to the extent you believe necessary. The trading strategies or related information mentioned in this article is for informational purposes only.
Disclosure: Interactive Brokers
Information posted on IBKR Campus that is provided by third-parties does NOT constitute a recommendation that you should contract for the services of that third party. Third-party participants who contribute to IBKR Campus are independent of Interactive Brokers and Interactive Brokers does not make any representations or warranties concerning the services offered, their past or future performance, or the accuracy of the information provided by the third party. Past performance is no guarantee of future results.
This material is from QuantInsti and is being posted with its permission. The views expressed in this material are solely those of the author and/or QuantInsti and Interactive Brokers is not endorsing or recommending any investment or trading discussed in the material. This material is not and should not be construed as an offer to buy or sell any security. It should not be construed as research or investment advice or a recommendation to buy, sell or hold any security or commodity. This material does not and is not intended to take into account the particular financial conditions, investment objectives or requirements of individual customers. Before acting on this material, you should consider whether it is suitable for your particular circumstances and, as necessary, seek professional advice.
Disclosure: Displaying Symbols on Video
Any stock, options or futures symbols displayed are for illustrative purposes only and are not intended to portray recommendations.