


When analysing the performance of financial securities, we give a lot of importance to the mean and the standard deviation as measures of the average return and risk, respectively.
However, the risk-adjusted performance of financial securities also depends upon the risks which arise due to the shape of the distribution of their returns. These are the higher-moment risks such as the skewness and kurtosis risks, which need to be taken into consideration for proper evaluation.
In this blog, we discuss the concept of kurtosis and its application in understanding the risk profiles of financial securities. In addition, we also glance over some common misconceptions regarding the calculation and interpretation of kurtosis.
What is kurtosis?
Kurtosis is a statistical measure which quantifies the degree to which a distribution of a random variable is likely to produce extreme values or outliers relative to a normal distribution.
From extreme values and outliers, we mean observations that cluster at the tails of the probability distribution of a random variable. In other words, kurtosis measures the ‘tailedness’ of distribution relative to a normal distribution.
Along with variance and skewness, which measure the dispersion and symmetry, respectively, kurtosis helps us to describe the ‘shape’ of the distribution.
Mathematically, the kurtosis of a distribution of a random variable X, with a mean μ and standard deviation σ is defined as the ratio of the fourth moment to the square of the variance

ie.
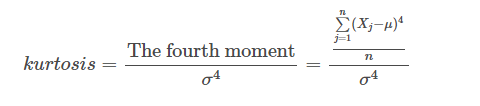
From the above expression, we can already see that outliers will significantly impact this value.
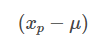
This is because for any outlier
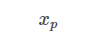
the value
will tend to be large anyway, but then the outliers contribution to the sum is raised to the power of four
i.e.
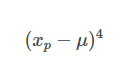
In other words, the key factor that would determine the value of kurtosis is the number and size of the outliers/extreme values, which are reflected in heavier/fatter tails of the distribution.
Contrary to popular perception, kurtosis does not measure the peakedness of the distribution, and the only unambiguous interpretation of kurtosis is with regard to the heaviness or lightness of tails of the distribution, relative to a normal distribution (we will see an example of this in a subsequent section).
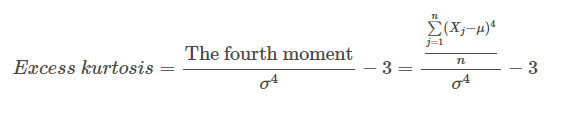
Excess kurtosis
There exists one more method of calculating the kurtosis called ‘excess kurtosis‘. As kurtosis is calculated relative to the normal distribution, which has a kurtosis value of 3, it is often easier to analyse in terms of excess kurtosis.
As the name suggests, it is the kurtosis value in excess of the kurtosis value of the normal distribution. This means that for a normal distribution with any mean and variance, the excess kurtosis is always 0.
Many resources refer to ‘excess kurtosis‘ as ‘kurtosis‘ and hence to avoid any confusion one must clarify this point beforehand.
In the next section, we will learn about the three categories of distributions based on the kurtosis.
Visit QuantInsti to download additional code: https://blog.quantinsti.com/kurtosis/.
Disclaimer: All investments and trading in the stock market involve risk. Any decisions to place trades in the financial markets, including trading in stock or options or other financial instruments is a personal decision that should only be made after thorough research, including a personal risk and financial assessment and the engagement of professional assistance to the extent you believe necessary. The trading strategies or related information mentioned in this article is for informational purposes only.
Disclosure: Interactive Brokers
Information posted on IBKR Campus that is provided by third-parties does NOT constitute a recommendation that you should contract for the services of that third party. Third-party participants who contribute to IBKR Campus are independent of Interactive Brokers and Interactive Brokers does not make any representations or warranties concerning the services offered, their past or future performance, or the accuracy of the information provided by the third party. Past performance is no guarantee of future results.
This material is from QuantInsti and is being posted with its permission. The views expressed in this material are solely those of the author and/or QuantInsti and Interactive Brokers is not endorsing or recommending any investment or trading discussed in the material. This material is not and should not be construed as an offer to buy or sell any security. It should not be construed as research or investment advice or a recommendation to buy, sell or hold any security or commodity. This material does not and is not intended to take into account the particular financial conditions, investment objectives or requirements of individual customers. Before acting on this material, you should consider whether it is suitable for your particular circumstances and, as necessary, seek professional advice.