


In this post, we will introduce how to do technical analysis with Python. Python has several libraries for performing technical analysis of investments. We’re going to compare three libraries – ta, pandas_ta, and bta-lib.
The ta library for technical analysis
One of the nicest features of the ta package is that it allows you to add dozens of technical indicators all at once. To get started, install the ta library using pip:
pip install ta
Next, let’s import the packages we need. We’ll be using yahoo_fin to pull in stock price data. Now, data contains the historical prices for AAPL.
# load packages
import yahoo_fin.stock_info as si
import pandas as pd
from ta import add_all_ta_features
# pull data from Yahoo Finance
data = si.get_data(“aapl”)
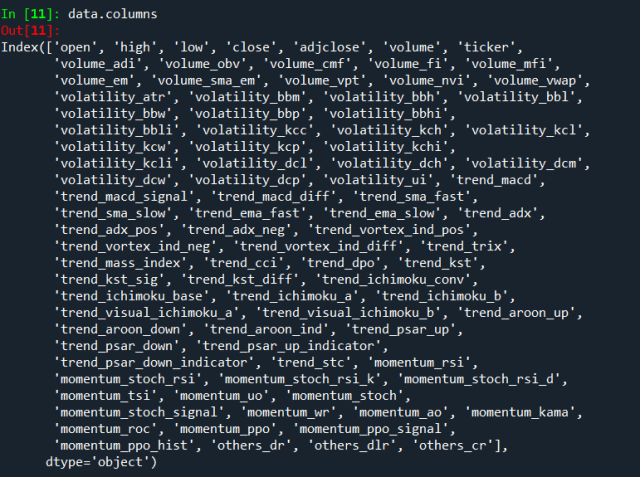
Next, let’s use ta to add in a collection of technical features. Below, we just need to specify what fields correspond to the open, high, low, close, and volume. This single call automatically adds in over 80 technical indicators, including RSI, stochastics, moving averages, MACD, ADX, and more.
# add technical analysis features
data = add_all_ta_features(
data, open=”open”, high=”high”, low=”low”, close=”adjclose”, volume=”volume”)
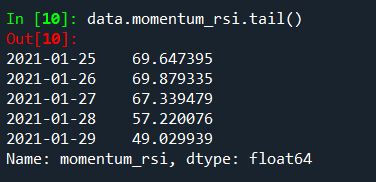
For example, here’s the RSI values (using the standard 14-day calculation):
ta also has several modules that can calculate individual indicators rather than pulling them all in at once. These modules allow you to get more nuanced variations of the indicators. For example, if you want to calculate the 21-day RSI, rather than the default 14-day calculation, you can use the momentum module.
from ta.momentum import RSIIndicator
rsi_21 = RSIIndicator(close = data.adjclose, window = 21)
data[“rsi_21”] = rsi_21.rsi()
Similarly, we could use the trend module to calculate MACD.
from ta.trend import macd
data[“macd”] = macd(data.adjclose, window_slow = 26, window_fast = 12)
To learn more about ta check out its documentation here.
Visit TheAutomatic.net for a tutorial on the pandas_ta library and read the rest of the article: http://theautomatic.net/2021/02/02/technical-analysis-with-python/
Disclosure: Interactive Brokers
Information posted on IBKR Campus that is provided by third-parties does NOT constitute a recommendation that you should contract for the services of that third party. Third-party participants who contribute to IBKR Campus are independent of Interactive Brokers and Interactive Brokers does not make any representations or warranties concerning the services offered, their past or future performance, or the accuracy of the information provided by the third party. Past performance is no guarantee of future results.
This material is from TheAutomatic.net and is being posted with its permission. The views expressed in this material are solely those of the author and/or TheAutomatic.net and Interactive Brokers is not endorsing or recommending any investment or trading discussed in the material. This material is not and should not be construed as an offer to buy or sell any security. It should not be construed as research or investment advice or a recommendation to buy, sell or hold any security or commodity. This material does not and is not intended to take into account the particular financial conditions, investment objectives or requirements of individual customers. Before acting on this material, you should consider whether it is suitable for your particular circumstances and, as necessary, seek professional advice.