


See Part I to get started.
Example of Unsystematic Risk
Let us assume that on 1st January 2019, you invested $100,000 in your portfolio, which is a diversified portfolio, and the investment goes as follows:
CISCO System – 15%
Citibank – 30%
Apple – 5%
Ford – 35%
Amazon – 10%
Berkshire Hathaway – 5%
Now, on 31st December 2019, you found that the total value of the portfolio now is $114,531 since there was an annual growth of 14.5% on total investment.
Below you can see a detailed calculation after breaking down the investments in your portfolio and the returns on the same:
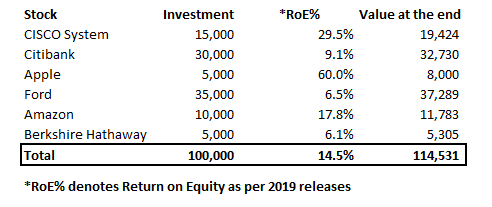
When you tried finding out which stocks performed well, you got to know that if you would have invested only in the financial services sector like Citibank and Berkshire Hathaway, the return would have been much lower.
But the companies like CISCO System, Apple, and Amazon fared well because of which you earned a 14.5% hike on your total investment of $100,000.Thus, you benefited from diversifying your portfolio.
The most beneficial part of unsystematic risk is that it is not correlated with the market risk and thus, can be eliminated with the help of diversification of the portfolio.
This way, you mitigated the unsystematic risk which gripped few companies such as Citibank, Ford, and Berkshire Hathaway because of some internal issue in them.
Let us see the formula used to calculate unsystematic risk now.
Formula for Unsystematic Risk
Unsystematic risk is represented by a firm’s beta coefficient. Beta coefficient is nothing but the volatility level of stock in the financial market.
Now, you can easily find the beta coefficient of your stock on an online website such as Yahoo finance. For instance, Apple Inc.’s beta coefficient on Yahoo finance is 1.17, whereas the beta coefficient of Microsoft is 0.93.
Since the beta coefficient of Microsoft is lesser, it represents that it is a less volatile stock and thus, more investment can be placed in Microsoft and less in Apple Inc.
We will calculate the overall beta or the potential risk resulting from your investment portfolio with the following formula:
Total Beta =
Percentage of total investment 1 x (Beta of investment 1) + Percentage of total investment 2 x (Beta of investment 2)
In the formula above, you can find out the beta of each investment i.e., investment 1 and investment 2 with the help of following formula:
Beta = Covariance/Variance
where,
Covariance implies the measurement of how two stocks move together. In case of movement of stocks together when their prices go up or down, it is a positive covariance. On the other hand, if they move away from each other, it is a negative covariance.
Variance implies the measurement of volatility of the price of a stock over a period of time. Also, this is the measurement of a stock in relation to its mean.
Great! Moving forward, we will also find out how you can calculate the unsystematic risk so that you are able to mitigate the same.
Visit QuantInsti to download sample code: https://www.quantinsti.com/
Disclosure: Interactive Brokers
Information posted on IBKR Campus that is provided by third-parties does NOT constitute a recommendation that you should contract for the services of that third party. Third-party participants who contribute to IBKR Campus are independent of Interactive Brokers and Interactive Brokers does not make any representations or warranties concerning the services offered, their past or future performance, or the accuracy of the information provided by the third party. Past performance is no guarantee of future results.
This material is from QuantInsti and is being posted with its permission. The views expressed in this material are solely those of the author and/or QuantInsti and Interactive Brokers is not endorsing or recommending any investment or trading discussed in the material. This material is not and should not be construed as an offer to buy or sell any security. It should not be construed as research or investment advice or a recommendation to buy, sell or hold any security or commodity. This material does not and is not intended to take into account the particular financial conditions, investment objectives or requirements of individual customers. Before acting on this material, you should consider whether it is suitable for your particular circumstances and, as necessary, seek professional advice.
Disclosure: Displaying Symbols on Video
Any stock, options or futures symbols displayed are for illustrative purposes only and are not intended to portray recommendations.