


")


The article “Using Machine Learning Programs to Forecast the Equity Risk Premium” first appeared on Alpha Architect blog.
The ability to predict stock returns and the equity risk premium (ERP) is of great interest to academics, financial practitioners, and investors, as future estimated returns have implications for asset allocations. To date, the best metric we have for forecasting future equity returns and the ERP is current valuations (whether using current P/E ratios or some cyclically-adjusted average such as Robert Shiller’s popular P/E 10 ratio).
Vanguard’s research confirmed the findings of previous studies that valuation metrics (such as P/Es) have had an inverse, or mean-reverting, relationship with future stock market returns – although it has only been meaningful at long horizons, explaining about 40% of the time variation in net-of-inflation (real) returns. Their results were similar to whether trailing earnings were smoothed or cyclically adjusted. Forty percent is a high figure for an asset as volatile as equities.
An interesting question is whether more complicated methods using newly developed machine learning models can provide superior forecasts. While current valuations assume a linear relationship, the benefit of machine learning approaches is that they can capture complex relationships between the target variable and predictors without imposing prior model assumptions. They can also deal with a large number of potential predictors, with an emphasis on dimension reduction techniques.
Xingfu Xu and Wei-Han Liu contribute to the literature with their 2023 study “Forecasting the Equity Premium: Can Machine Learning Beat the Historical Average?.” They selected seven machine learning methods used by Shihao Gu, Bryan Kelly, and Dacheng Xiu in their 2019 study “Empirical Asset Pricing via Machine Learning”: partial least squares (PLS), principal components regression (PCR), least absolute shrinkage and selection operator (LASSO), elastic net (ENet), gradient boosted regression trees (GBRT), random forest (RF), and neural networks with three layers (NN3), as well as four others—support vector regression, k-nearest neighbors, adaptive boosted trees, and extreme gradient boosted trees)—and their combination method. They chose these last four because existing studies demonstrate their strong predictive power in other financial predictions.
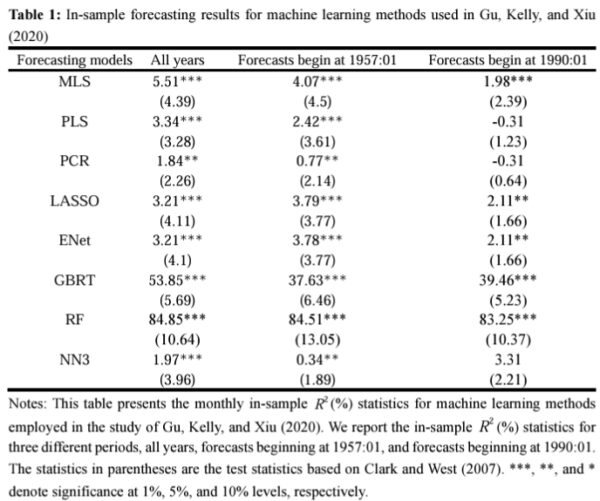
For prediction performance comparison, they provided both in-sample and out-of-sample analyses of the employed machine learning methods with that of the historical average benchmark. They followed common machine learning practice, splitting the data into training, validation, and testing sets. The training and validation sets were fixed at 85% and 15% of the in-sample data, respectively. Their data covered the period December 1926-December 2020. Using 12 macroeconomic variables (including dividend yields, volatility, earnings/price, book-to-market, net new issuance, the rates on Treasury bills and long-term Treasury bonds, the default spreads between corporate bonds of high versus lower quality and between corporates and Treasurys, and inflation) and 12 technical predictors (based on trend-following strategies such as moving averages and momentum), they found:
Most machine learning methods, especially two tree-based models (random forest and extreme gradient boosted trees), can achieve a very high in-sample fit (an R-squared of more than 80% in monthly samples).
However, when it comes to the out-of-sample forecasts of different evaluation periods, the competing forecasting models generally failed to outperform the historical average benchmark.
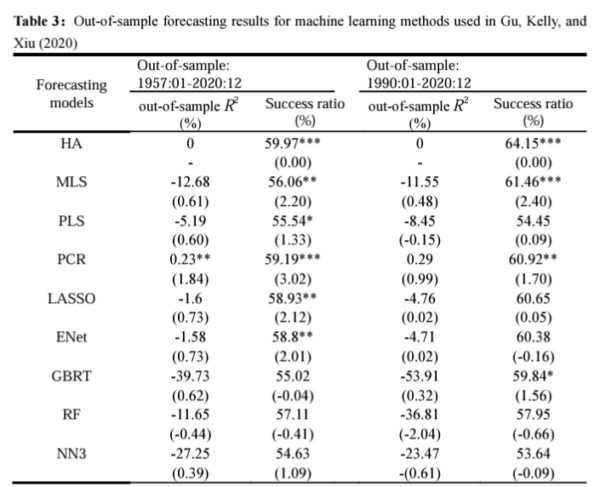
Notes: This table reports the out-of-sample prediction results for machine learning methods employed in the study of Gu, Kelly, and Xiu (2020). ‘HA’ denotes the historical average benchmark. The statistics in parentheses corresponding to out-of-sample R-squares and success ratio are their respective test statistics based on Clark and West (2007) and Pesaran and Timmermann (1992). ‘-’ means that the statistics are not available. ***, **, and * denote significance at 1%, 5%, and 10% levels, respectively. [The success ratio measures directional correctness.]
- The results were robust to the choice of window estimation schemes, data frequencies, and alternative macroeconomic datasets.
- The historical mean was confirmed as the best forecast in terms of out-of-sample R-squared.
- The historical average had higher success ratios than the models.
Xu and Liu attributed
“the underperformance of machine learning in equity premium prediction to the insufficiently large datasets, the low sign-to-noise ratio, and the evolving markets. We notice that machine learning methods fail to improve forecast accuracy, especially in out-of-sample situations. … The changing characteristics of markets modify the relation between predictors and the equity premium and exhibit significant noise along the evolution process. A robust predictable pattern in equity premium predictions usually fails to survive for a long while.”
They explained:
“Although our monthly datasets for the equity prediction problem cover a long period of more than 90 years, our datasets are still small in scale from the perspective of machine learning requirements. Essentially, machine learning is designed for large-scale and highly complex multi-dimensional datasets, but our dataset comparatively fails to meet those requirements for equity premium predictions.”
The finding that the more sophisticated models were not able to outperform the simple historical benchmark is consistent with the findings of Amit Goyal and Ivo Welsh, authors of the study “A Comprehensive Look at the Empirical Performance of Equity Premium Prediction.”
Their findings led Xu and Liu to conclude:
“Essentially, machine learning methods can be handicapped by their in-sample overfitting. This study advises us not to be over-optimistic about the usage of machine learning in forecasting the equity premium. The excellent in-sample performance of machine learning can backfire in the context of real-world out-of-sample return predictions due to overfitting.” They ended with this hopeful note: “We expect there is ample room to improve existing machine learning algorithms to enhance their out-of-sample forecasting ability.”
Investor Takeaway
Xu and Liu demonstrated that more sophisticated models do not necessarily produce superior results. In fact, they are prone to “overfitting” the data. While advanced machine learning models could not outperform the historical return benchmark, we know that valuations matter to future returns. Thus, investors are best served by not using the historical mean return when estimating future returns. Instead, they should use current valuation metrics such as the CAPE 10. With that said, investors must be sure to treat any estimate in a probabilistic (not deterministic) manner. The following table from the 2017 paper “The Many Colours of CAPE,” by Robert Shiller and Farouk Jivraj, shows that while the CAPE 10 provided valuable information as to future returns, there was still a wide dispersion of potential outcomes.
| Q1 1926 – Q2 2017 | |||||
| Starting CAPE Ratio | Real 10-year S&P 500 Annualized Returns (%) | ||||
| Average | Low | High | Average | Worst | Best |
| 8.6 | 5.6 | 9.6 | 9.8 | 4.2 | 17.2 |
| 10.3 | 9.6 | 11.0 | 10.6 | 3.8 | 16.9 |
| 11.5 | 11.0 | 12.1 | 10.0 | 2.6 | 14.7 |
| 13.0 | 12.1 | 13.9 | 8.7 | 0.7 | 14.1 |
| 15.0 | 13.9 | 16.1 | 7.8 | -1.6 | 15.0 |
| 17.0 | 16.1 | 17.8 | 5.4 | -3.8 | 14.6 |
| 18.7 | 17.8 | 19.9 | 5.0 | -4.0 | 13.5 |
| 21.0 | 19.9 | 22.0 | 2.7 | -3.3 | 8.6 |
| 24.1 | 22.0 | 26.4 | 2.5 | -4.0 | 7.3 |
| 33.2 | 26.4 | 44.2 | 0.9 | -6.1 | 5.8 |
The results are hypothetical results and are NOT an indicator of future results and do NOT represent returns that any investor actually attained. Indexes are unmanaged and do not reflect management or trading fees, and one cannot invest directly in an index
The takeaway is that investment plans should address the potential for those other possible outcomes to occur. Do you have a “Plan B”? If not, let this serve as a wake-up call.
Larry Swedroe is head of financial and economic research for Buckingham Wealth Partners, collectively Buckingham Strategic Wealth, LLC and Buckingham Strategic Partners, LLC.
The opinions expressed here may not reflect those of Buckingham Wealth Partners. For informational and educational purposes only and should not be construed as specific investment accounting, legal, or tax advice. Certain information is based on third party data and may become outdated or otherwise superseded without notice. Indices are not available for direct investment. Their performance does not reflect the expenses associated with the management of an actual portfolio nor do indices represent results of actual trading. Information from sources deemed reliable, but its accuracy cannot be guaranteed. Performance is historical and does not guarantee future results. All investments involve risk, including loss of principal. Neither the Securities and Exchange Commission (SEC) nor any other federal or state agency have approved, determined the accuracy, or confirmed the adequacy of this article. LSR-24-649
Disclosure: Alpha Architect
The views and opinions expressed herein are those of the author and do not necessarily reflect the views of Alpha Architect, its affiliates or its employees. Our full disclosures are available here. Definitions of common statistics used in our analysis are available here (towards the bottom).
This site provides NO information on our value ETFs or our momentum ETFs. Please refer to this site.
Disclosure: Interactive Brokers
Information posted on IBKR Campus that is provided by third-parties does NOT constitute a recommendation that you should contract for the services of that third party. Third-party participants who contribute to IBKR Campus are independent of Interactive Brokers and Interactive Brokers does not make any representations or warranties concerning the services offered, their past or future performance, or the accuracy of the information provided by the third party. Past performance is no guarantee of future results.
This material is from Alpha Architect and is being posted with its permission. The views expressed in this material are solely those of the author and/or Alpha Architect and Interactive Brokers is not endorsing or recommending any investment or trading discussed in the material. This material is not and should not be construed as an offer to buy or sell any security. It should not be construed as research or investment advice or a recommendation to buy, sell or hold any security or commodity. This material does not and is not intended to take into account the particular financial conditions, investment objectives or requirements of individual customers. Before acting on this material, you should consider whether it is suitable for your particular circumstances and, as necessary, seek professional advice.
Join The Conversation
If you have a general question, it may already be covered in our FAQs. If you have an account-specific question or concern, please reach out to Client Services.