


Introduction
Understanding market structure, historical outcomes, and a changing investing landscape can help more investors get the odds of investing success in their favor.
In this week’s newsletter, Drawing Capital utilizes a data-informed approach to assess and analyze equity index data across the past few decades for the NASDAQ 100 Index (index ticker: NDX), S&P 500 Index (index ticker: SPX), Dow Jones Industrial Average (index ticker: INDU), and the Russell 2000 Index (index ticker: RTY).
Obviously, while future performance can deviate from historical returns, understanding the historical return profile and distribution of event probabilities help to imagine investing possibilities and provide a historical context.
A quick note: when this article refers to “buying the index”, this is a theoretical proposition. In reality, it is typically not possible to actually “buy the index”, and investors can seek to track the performance of an index through buying a high-quality index fund. Traits that help determine if an index fund is of high quality include:
- Low tracking error relative to an underlying benchmark index
- Low expense ratios and fees
- High liquidity and volume
- High reputation and quality of index fund provider
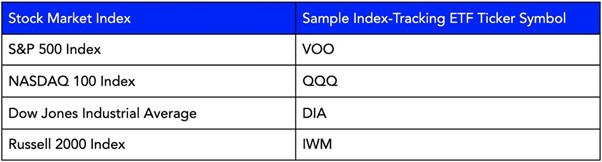
Since an index itself cannot be bought, here’s a sample list of ETFs that track the 4 indices mentioned below:
Key Insights:
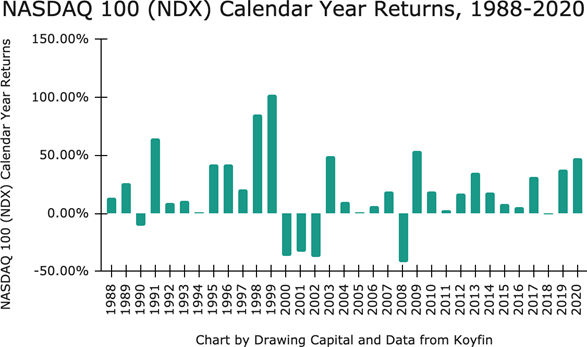
- The clustering of returns from 1995-1999, followed by 2000-2002, demonstrates the significance of the bubble in telecom, technology, and internet stocks, followed by the bursting of the dot-com bubble.
- Aside from a near 1% loss in 2018, the NASDAQ 100 Index has generated strong returns since 2009.
- Despite the coronavirus crisis and resulting economic catastrophe, the NASDAQ 100 Index enjoyed strong positive performance in 2020, highlighting the strong demand in innovation-focused themes, such as e-commerce, work-from-home beneficiaries, software companies that focus on digital transformation, fintech, biotech, and more.
Key Insights:
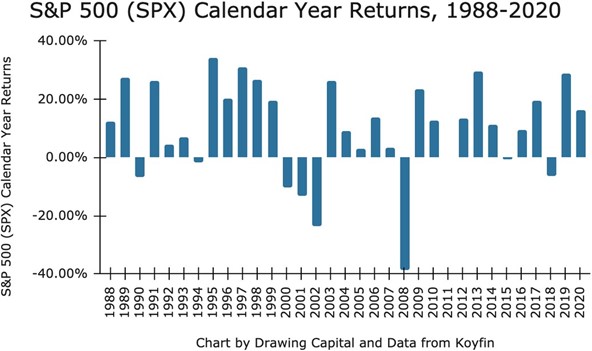
- From 1988-2020, S&P 500 Index performance was positive for the majority of calendar years.
- From 1988-2020, the 2008 calendar year was the worst calendar year performance for the S&P 500 Index.
Key Insights:
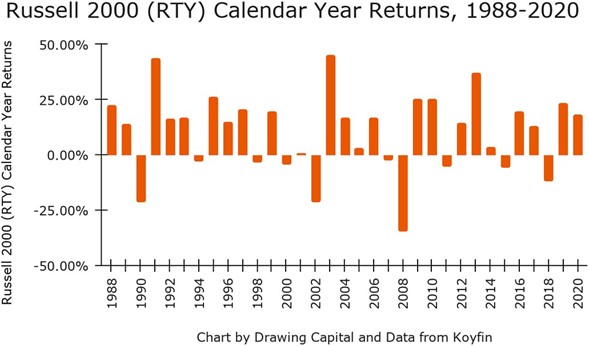
- It is common to see positive double-digit percentage returns in a calendar year for the Russell 2000.
- In 2008, the Russell 2000 experienced a smaller calendar year loss compared to the NASDAQ 100 and S&P 500.
Overall, it is clear that small companies and tech-focused companies provide some of the best growth stories, which help drive the historical positive performance of the NASDAQ 100 and Russell 2000 indices.
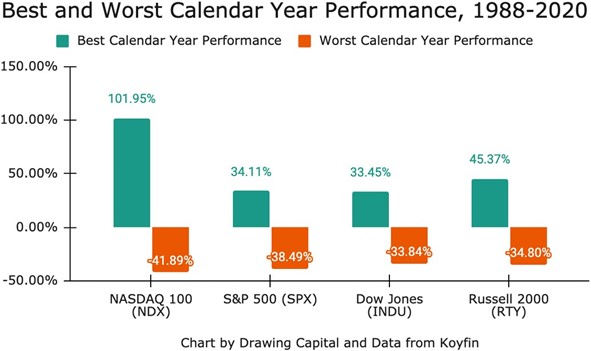
Interestingly, despite the popular perception that small-cap companies are riskier than large-cap companies, this chart showcases that between 1988-2020, the Russell 2000 Index actually experienced a higher high-point and a better low-point compared to the S&P 500 Index in terms of calendar year returns.
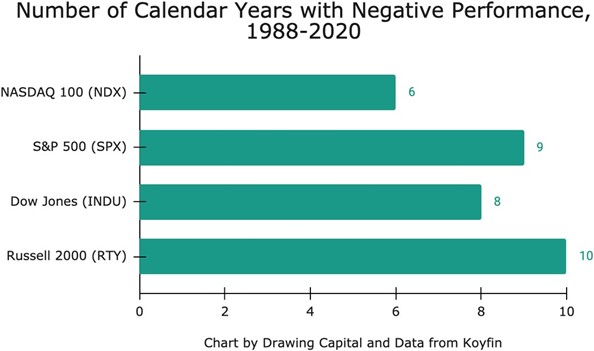
Compared to the three other indices in the measured time range, the NASDAQ 100 Index historically has fewer calendar years of negative performance, and many of the negative performing years for the NASDAQ 100 Index were clustered around the bursting of the tech bubble in the years 2000-2002.
Assessing Probabilities and Historical Occurrences of Positive Performance Events
The “historical occurrences and return outcomes” in the following charts below demonstrate that longer holding periods are typically associated with better investment returns for these indices.
The phrase, “blindly buying”, refers to an investor randomly “buying” an index on any trading day at its closing price. In addition, by incorporating the “blindly buying” component to the analysis, it somewhat removes the timing element of buying and selling index funds, which supports a known phrase in the investment community: “time in the market is often more important than timing the market”.
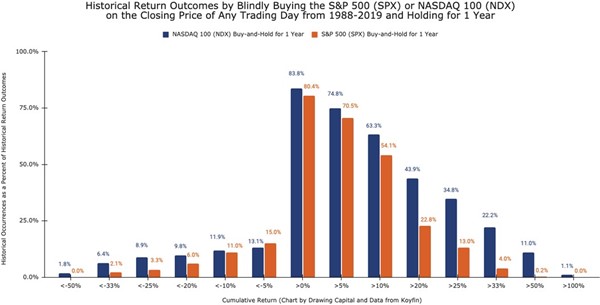
Key takeaway: Buying the NASDAQ 100 Index at the closing price of any trading day between 1988-2019 and holding this investment for 1 year would have produced a positive return about 84% of the time.
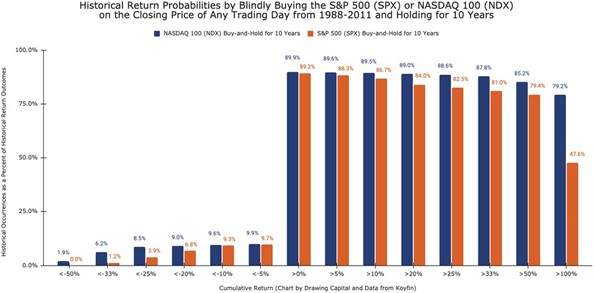
Key takeaway: Buying the NASDAQ 100 Index at the closing price of any trading day between 1988-2011 and holding this investment for 10 years would have at least doubled the investment’s value about 79% of the time.
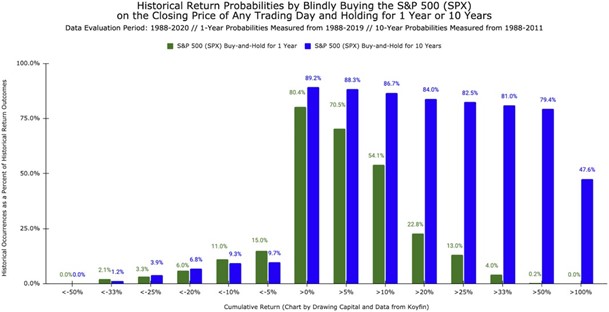
Key takeaways:
- Buying the S&P 500 Index at the closing price of any trading day between 1988-2019 and holding this investment for 1 year would have produced a positive return about 80% of the time.
- Staying invested in the long term leads to a high probability of generating positive returns. As seen in the above chart, buying the S&P 500 Index at the closing price of any trading day between 1988-2011 and holding this investment for 10 years would have produced a positive return about 89% of the time.
- It is typically easier to compound returns over long time periods compared to very short durations. Positive compounding of returns is advantageous to investors. As seen in the above chart, buying the S&P 500 Index at the closing price of any trading day between 1988-2011 and holding this investment for 10 years would have produced a greater than 50% cumulative return about 79% of the time.
Concluding Thoughts
Many very successful long-term investors care deeply about 2 traits: avoidance of permanent long-term capital loss (i.e. avoid losing money) and finding businesses that compound at high and growing rates of return.
While short-term investors are typically price-sensitive (and therefore are often focused on price multiples and current sentiment), long-term investors desire growing cash flows from a business over time, which thereby increases a company’s intrinsic value and stock price.
By evaluating the historical data for the NASDAQ 100 Index (index ticker: NDX), S&P 500 Index (index ticker: SPX), Dow Jones Industrial Average (index ticker: INDU), and the Russell 2000 Index (index ticker: RTY), it is clear that a longer holding period for index funds tracking these indices on average reduces the probability of permanent capital loss and simultaneously provides the opportunity to grow an investment’s value over time.
Notably, understanding market structure, historical outcomes, and a changing investing landscape can help more investors get the odds of investing success in their favor.
To receive more insights and ideas delivered straight to your inbox every week for free, please subscribe to Drawing Capital’s newsletter at drawingcapital.substack.com.
This letter is not an offer to sell securities of any investment fund or a solicitation of offers to buy any such securities. An investment in any strategy, including the strategy described herein, involves a high degree of risk. Past performance of these strategies is not necessarily indicative of future results. There is the possibility of loss and all investment involves risk including the loss of principal.
Any projections, forecasts and estimates contained in this document are necessarily speculative in nature and are based upon certain assumptions. In addition, matters they describe are subject to known (and unknown) risks, uncertainties and other unpredictable factors, many of which are beyond Drawing Capital’s control. No representations or warranties are made as to the accuracy of such forward-looking statements. It can be expected that some or all of such forward-looking assumptions will not materialize or will vary significantly from actual results.
Drawing Capital has no obligation to update, modify or amend this letter or to otherwise notify a reader thereof in the event that any matter stated herein, or any opinion, projection, forecast or estimate set forth herein, changes or subsequently becomes inaccurate.
This letter may not be reproduced in whole or in part without the express consent of Drawing Capital Group, LLC (“Drawing Capital”). The information in this letter was prepared by Drawing Capital and is believed by the Drawing Capital to be reliable and has been obtained from sources believed to be reliable. Drawing Capital makes no representation as to the accuracy or completeness of such information. Opinions, estimates and projections in this letter constitute the current judgment of Drawing Capital and are subject to change without notice.
Disclosure: Interactive Brokers
Information posted on IBKR Campus that is provided by third-parties does NOT constitute a recommendation that you should contract for the services of that third party. Third-party participants who contribute to IBKR Campus are independent of Interactive Brokers and Interactive Brokers does not make any representations or warranties concerning the services offered, their past or future performance, or the accuracy of the information provided by the third party. Past performance is no guarantee of future results.
This material is from Drawing Capital and is being posted with its permission. The views expressed in this material are solely those of the author and/or Drawing Capital and Interactive Brokers is not endorsing or recommending any investment or trading discussed in the material. This material is not and should not be construed as an offer to buy or sell any security. It should not be construed as research or investment advice or a recommendation to buy, sell or hold any security or commodity. This material does not and is not intended to take into account the particular financial conditions, investment objectives or requirements of individual customers. Before acting on this material, you should consider whether it is suitable for your particular circumstances and, as necessary, seek professional advice.