


CMT’s Tyler Wood discusses the relative strength and weakness of technical analysis and, despite a woeful outlook on the US economy, offers a positive outlook from a charting perspective.
Contact Info:
TYLER WOOD, CMT
Website: CMTAssociation.org
CoHost of Fill the Gap
Note: Any performance figures mentioned in this podcast are as of the date of recording (July 5, 2023).
Summary – IBKR Podcasts Ep. 93
The following is a summary of a live audio recording and may contain errors in spelling or grammar. Although IBKR has edited for clarity no material changes have been made.
Andrew Wilkinson
Welcome to this IBKR podcast. My name is Andrew Wilkinson, and in today’s episode, I’m going to be chatting with Tyler Wood, who is the managing director at the CMT. And that stands for the Chartered Market Technician Association. Welcome, Tyler, how are you?
Tyler Wood
I’m doing great, Andrew. Thanks for having me back. Good to see you.
Andrew Wilkinson
It’s an absolute pleasure. I think folks, if you look up on IBKRpodcast.com, you will find my prior recording in December or January with Tyler at the CMT. Tyler, we’re recording this episode on July the 5th, but to get things started, we’re going to do a bit of a technical analysis 101. So, investing through the lens of technical analysis can be radically different than fundamental investing. Can you simplify what it is that investors are trying to understand or take away from their charts?
Tyler Wood
The background that I come from is a little helpful. I did my MBA at Indiana University, where I was given a strict diet of fundamental analysis. A lot of corporate finance pouring over what management teams were doing to allocate capital throughout their firms. The new products that were going to generate future cash flows and coming up with a lot of different ways that you could value a company. So, with technical analysis and what I started to learn about 12 years ago when I got to New York City was that markets operate partly on intrinsic value, right— long term trends are always going to be driven by the fundamentals, the expanding GDP of the nation and the sound practices of the companies that we are investing in. However, markets and we’re talking about public capital markets, stocks with liquidity, right? Then we’re talking about investor behavior and it’s less a game of blackjack. We’re not just playing against the house; we’re playing a game of poker and there are a lot of other investors involved. So technical analysis seeks to understand what those moods, what that sentiment, what investors writ large are looking to invest in, what they find value in. And it’s that collective opinion of our entire marketplace that dictates what happens to price. So, it’s a very simple supply and demand relationship and technical analysis provides this set of tools to see what’s happening in real time with investors. So, when you think about, you know, the narratives that we’re all exposed to, 2023 is a great example. I can’t tell you how many macro research analysts that I know, and respect have a very dark take on where the economy is headed. We’re up for a recession. There’s a debt ceiling crisis one week, there’s a war in Europe. There’s runaway inflation. We have bank failures left and right. And yet the market continues to climb higher, so technical analysis, in its best form, is used as a complement to fundamentals. For all the fundamental analysts and investors out there, I want you to understand that what you do is very valuable, but you can become a better portfolio manager, a better analyst and a better trader by adding a technical toolkit to your discipline; they work hand in hand. Understanding the companies that you’re investing in or what makes them a good investment long term, I would have nothing negative to say about that. However, when it comes to making trade decisions, what you’re really up against is the rest of the poker players at the table and understanding how their positioning is really key to your success.
Andrew Wilkinson
And so, you’re looking at four things: trend, momentum, volume, and volatility. Can I ask you to break down, within those four, what are they and how is the data relevant?
Tyler Wood
So, let’s take them in that order. Identifying a trend from the technical lens, that’s the most important job we have. If we can identify a trend, then we can profit on the majority of a move. Now, if you just pull up a price chart, Andrew, and you’re looking at something that’s generally moving from the lower left corner to the top right corner of your chart, it’s in an uptrend, right? You’re just eyeballing it, but you can see a series of higher highs and higher lows, and that’s great in hindsight. And if we could, you know, have a time machine, and just invest in things in hindsight, that’d be great. But we have to develop tools that help us identify or create our own rules for identifying when that trend has begun. Now, there are a lot of wonderful technical tools out there. Let’s just talk about a couple of them; Donchian channels, for anybody who’s read the books about the turtle traders, Richard Dennis teaching these folks that didn’t have prior experience. The CMT association was very honored to have Jerry Parker, who was one of the original turtle traders, just at our conference a couple months ago. And spending some time with Jerry, he said his process hasn’t changed dramatically as a trend following investor. One of the inputs that Richard Dennis was teaching the turtle traders was Donchian channels, price channels, as a means to enter trends. And all we’re doing is looking at a N period look-back and identifying series of new highs or higher lows and using those price channels can help us identify when a trend is beginning. We also know almost everyone in the industry is putting moving averages on their charts, right? So, if price is higher than its historical average, that’s bullish, right? It’s higher than it was before, but a lot of traders aren’t going to stop with just one moving average, right? If one is good, then three or four or five might be even better, and so you can start to develop systems where shorter period moving averages are crossing above longer period moving averages— that could be an entry signal, an exit signal being that shorter period moving below the longer period. And also looking at the inflection of those moving averages— are they turned upward? Is it a rising moving average above, you know, short term above a longer period? But then you can get into some complexity, right? Moving averages, Donchian channels, these are great. You could start to look at other tools as well to identify trends. Classical technical analysis going back to Edwards and Magee in the 1940s. They’re looking at areas of support and resistance, you know, clear levels where we might be breaking above a trend line. Looking at price pattern analysis is very subjective, it’s up to the individual to interpret what’s going on, but there’s a lot of value in those tools that they developed prior to computing power, right? We just have more at our fingertips now to use in the technical lens, but that classical work is still very valid. You could start to identify trends, but the most important part of using these technical tools is that an individual trader or analyst has their own set of rules, right? You want a checklist, you don’t want to rely on just one indicator, cause it’s not always going to work; these are tools that work in probabilities. If you’re reliant on just a single tool, then you’re going to expose yourself to undue risk. So, you think about that checklist and a lot of the most decorated, highly followed technical analysts in the industry have a composite approach. They want to look at the weight of the evidence. So, trend identification is the first piece and then you move on from there. Moving averages are lagging indicators. If we identify trends, it’s not going to capture the absolute top or the absolute bottom. So, you start to add the next piece and there are derivative indicators that look at momentum. George Lane invented stochastics, brought those to the industry in the 1950s. And what we’re looking at in terms of momentum, there are a lot of momentum tools out there. You could look at simple rate of change. You could look at a commodity channels index. You could look at stochastics, you could look at RSI, which is the Relative Strength Index, not to be confused with relative strength of one asset or one security against another. But the RSI is very popular, and these momentum indicators are basically the leading indicators. What we’re trying to understand is if that trend is moving upward, we’ve identified that we’re in an uptrend, then we want to know if the market is supporting that or is it coming to a period of exhaustion. So, on a technical chart, you can add panel after panel after panel below your price action to start to give you derivative indicators that tell you what’s happening with momentum. Some of these are range bound, right? They move from negative 100 to positive 100, or zero to 100. Some of them are unbounded, and we know with those when we get into things like the meme stocks, you can have an unbounded indicator that’s registering information that really doesn’t give you any insight into what’s happening with the stock because it’s so far off the scale. So technical analysis, first and foremost, is a way to structure data— to look at what the market is telling us and what we’re trying to do is separate our opinion from what’s actually happening. And instead of anticipating where the market’s going, we can simply react responsibly. So, we’ve got our trend identification pieces, market momentum that can tell us if a trend is coming to a period of exhaustion or acceleration. The next piece that investors might want to look at is volume, and this goes all the way back to Charles Dow, 130 years ago. This gentleman was observing markets, writing for what became the Wall Street Journal, and volume is the first confirmatory indicator, meaning we have higher prices but if we look at the volume of trading that’s happening at those higher prices, we can start to get a sense of whether or not there’s enthusiasm. Does everybody still like Apple at this price, or is it just getting too high? Now, I’m going to pick on my fundamental friends a little bit more, Andrew. When you start to think about P/E— if we think about price to earnings, right? We’re looking at a long-term historical average with something like the Cape Shiller ratio that averages out around 18. But we also know that in Bull Markets, P/E ratios can be extended well beyond their historical average. And in that period, post-great financial crisis right up until the COVID collapse, we had fundamental analysts criticizing this overpriced market every single quarter. And yet it continued to climb higher. So, as Ned Davis wrote in his famous book, Being Right or Making Money, you have to decide what your objective is. And if your objective is to make money, then you shouldn’t care about being right, right? Maybe things are overvalued. Maybe U.S. equities are expensive relative to the rest of the world, but with a technical toolkit you can also find those things that are trending. So, volume is going to give us that indication of how much participation and enthusiasm there is in the marketplace or stocks or any security at higher and higher prices. And the last piece that you mentioned, Andrew, in terms of volatility, there are really impressive tools created by technical analysts, many of them CMT charter holders like our good friend John Bollinger. If you’re familiar with Bollinger bands, those can be used for trend identification, but also for capturing volatility compression. Volatility is that fourth piece that a trader has to keep in mind. So, with Bollinger bands— I’m going to take you back to early math classes, 2 standard deviations from a mean should encapsulate about 95% of a normally distributed data set. Now we know markets aren’t perfectly normally distributed because investor behavior doesn’t allow for perfect modeling, but we know that most of the market data is going to be captured in those two standard deviations. So, when a Bollinger band expands, when price pushes those bands to wider levels, we know that’s significant activity. When price becomes narrow, when the range of price action becomes narrow, I should say, Bollinger bands narrow, and that volatility compression is an important leading indicator for us to look at whether it’s going to be a trend continuation; then in an uptrend, we see this period of consolidation, right? The market makes new gains and then drift sideways for a while or maybe even counter corrects a little bit— that narrowing of price activity and the narrowing of the Bollinger bands tells us we’ve got this volatility compression that could either precede trend continuation or trend reversal, so that’s the big question, right? Is this the end of the trend? Should we be getting out or is this just a pause point on the trail to ever higher prices? And the answer comes from looking at the direction of the break. So, traders are looking at Bollinger bands to decide— all right, we’ve seen this narrowing of volatility, let me trade in the direction of the break. When volatility expands and you have higher velocity, price moves in the direction of that price. So those are really the four core pieces of the technical toolkit. We have to identify trends. We want to understand the momentum of that price action — is it extending and accelerating or is it coming to a period of exhaustion? Volume is going to tell us whether the market is participating, and volatility is going to highlight those areas where you’ve got that tug of war between buyers and sellers where we don’t have a clear, decisive winner in the marketplace. And that’s all a way to visualize what’s happening with investor behavior. It’s a really powerful set of tools.
Andrew Wilkinson
You sat technical and fundamental analysis alongside each other. If you put your critics hat on, what would you say are the problems with technical analysis?
Tyler Wood
I am so glad you asked because the danger with these tools and I’ve fallen prey to this as well, right? I got so excited. I met Ralph Acampora twelve years ago at the CMT office and Phil Roth and Louise Yamada and they all spent time with me. They’re very generous, caring individuals in terms of wanting to educate the next generation. And the pitfall that a lot of folks fall into is that you start learning about these indicators; that one is fantastic, that’s great insight—let me add that, you know. I’ve got all of these moving averages, but you know what, I also want to have Fibonacci levels on my chart so I can see important retracement and extension levels. And you know what— I want to add 10 different momentum indicators, stochastics, oscillators. Maybe you want to look at MACD. You know, you start piling all of these tools onto your chart and you lose the objective that we originated from, which is to be objective and to limit our emotional impact on our trade decisions. Once you have enough squiggly lines on your chart, Andrew, you can convince yourself of whatever you want, right? If you just lost a ton of money on Netflix, then you’re not going to want to buy back in even when all of those indicators are telling you that a new trend has begun. You’re anchored; you have these recency biases and all of these heuristics to our behavior that can cloud objective judgment. And when you think about how much input we have in our lives from financial news media, would we have missed out on everything in the first half of this year because we’re scared of, you know, the world ending? How many times have they said the world was going to end? Many, many, many times. But I think listening to the message of the market and simplifying your process to have fewer distracting tools on your chart—that’s the name of the game. Technical analysis can be overwhelming if you let it and that indicator overload or that analysis paralysis— that comes from a lot of redundant indicators, right? That’s just clutter. At other times, indicators can be contradictory. So, for the analyst, if you start, you know, adding 15,20, 60 different tools on your chart, which ones are you following and when? And if you’re not, you know, rules based and have a repeatable process, then you’re just going to introduce all of those emotions again and pick which tool you want to look at on any given day.
Andrew Wilkinson
So, let’s turn to the markets now and look at the performance at the end of the first half of 2023 for several key markets. Why don’t we run through the S&P 500, 10-year treasury yields, the dollar index, crude oil, and gold prices?
Tyler Wood
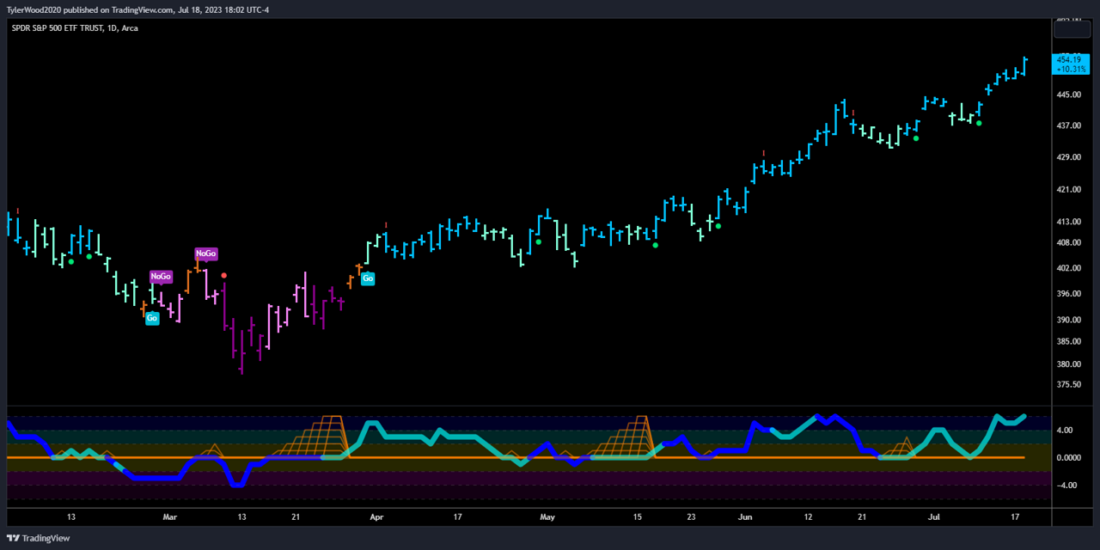
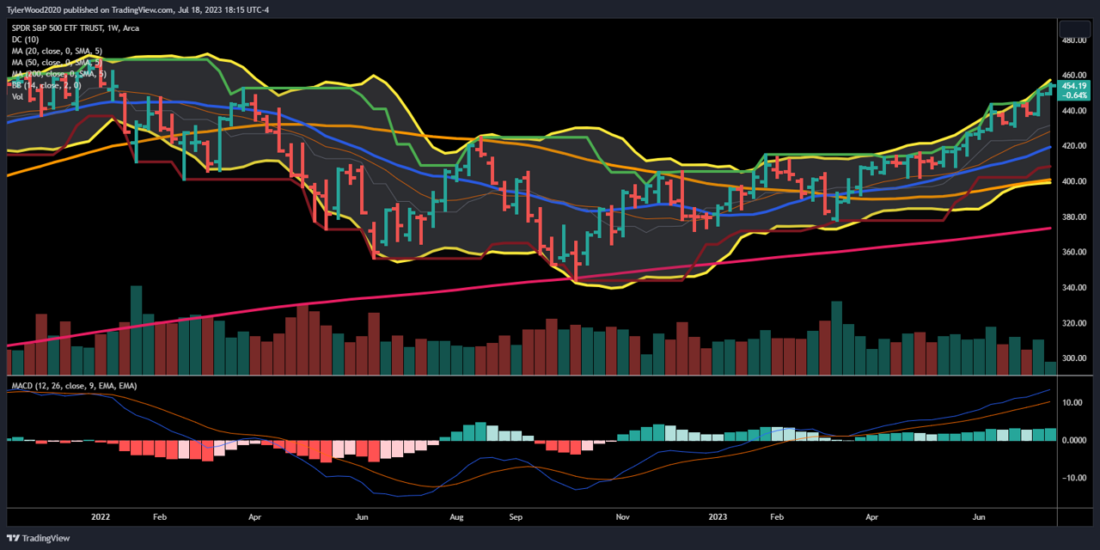
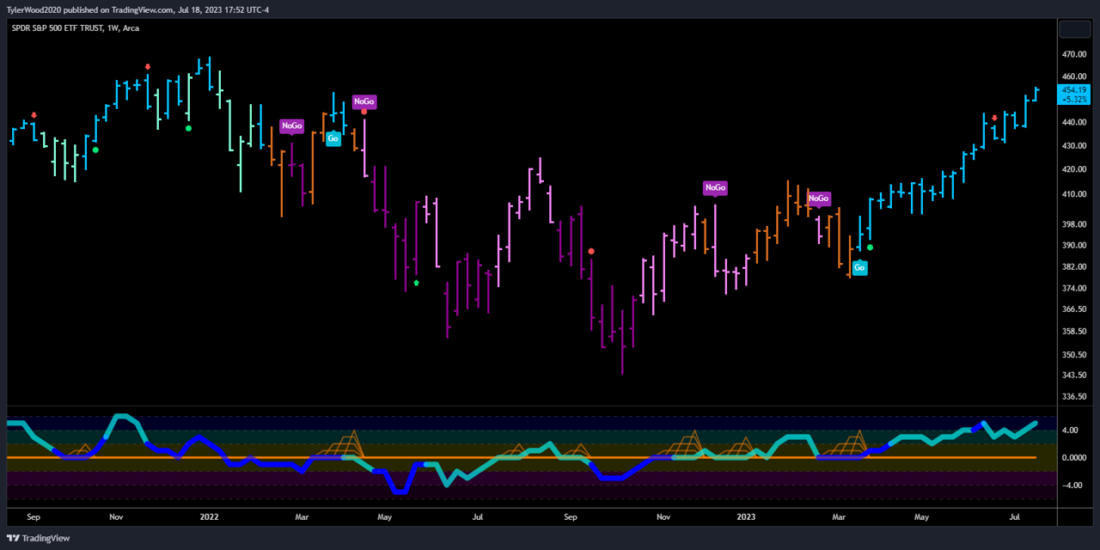
The danger for a lot of folks with the equity indices, right? It is a market of stocks, not a single stock market. But you got to start somewhere. So, with the S&P 500, we’re at 4446 today. But what’s screaming off the charts is that through 2023, we’ve had a series of higher highs and higher lows, the penultimate low was in October of last year, certainly nobody was anticipating that we would come out of those doldrums of 2022 so well. But once you start to surpass what was resistance, then it becomes support; that’s the concept of polarity. So, when we look at those, you know, relief rallies that we had in 2022 in August and September, we reached some pretty attractive highs. It just turned out to be a relief rally and we had another leg lower. Those were really seducing a lot of investors to get back involved in the S&P. So, to establish a new trend in 2023, the series of higher highs and higher lows are important, but then we also have to clear those resistance areas— that comes right back to investor behavior as well, Andrew. People anchor to those prices and if you were one of those investors that got exposed to equities in the U.S. in August of 2022, then you were just dying to get out at a breakeven level. So, what creates overhead supply is that there are a lot of sellers at those levels. And then you also have to, you know, recognize that when the market breaks through those levels, there’s more demand, right? The supply demand relationship is in favor of the Bulls, the buyers. There is demand that’s pushing price higher. And so, in 2023, once we surpassed those key levels around 4250 and 4300, it was very clear to a lot of technicians that we were in a continuous secular bull market, right? So, they’re cyclical and secular. This all depends on your time frame, and I think for everybody listening to the podcast, if you’re an intraday trader and you’re talking to a research analyst or a macro economist, they’re looking at monthly and quarterly data. Their opinion is not reflective of what’s happening intraday— that’s noise to them and the signal is coming from much longer-term data and charts. So, the S&P 500 is in an uptrend. I’m very bullish on the market and of course, what’s happening under the hood, but for U.S. equities we’ve got another ultimate high to clear before we’re at all-time highs, but we’ve got some room to run.
Andrew Wilkinson
Not the sort of thing you’re expecting when everybody’s talking about recession, right? And so, kind of the background of that is rising interest rates, let’s talk about the 10-year note or yields in general. Where are we with yields?
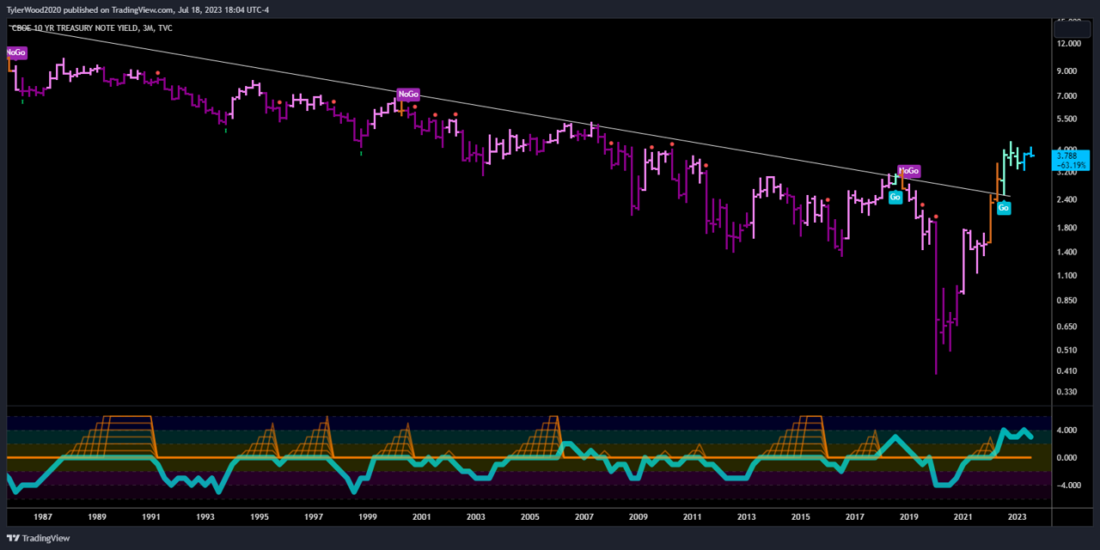
Tyler Wood
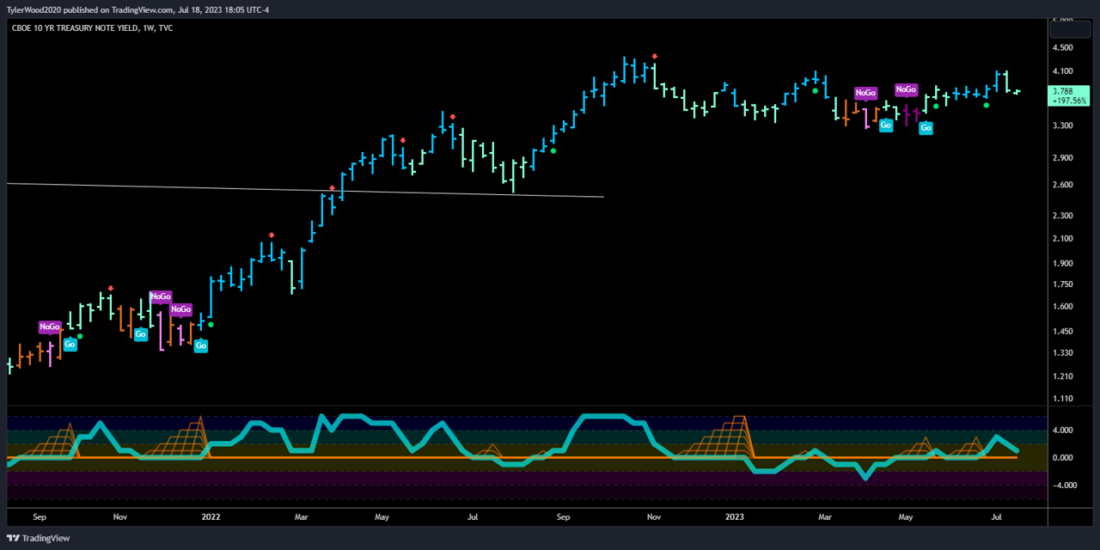
Yeah. So, if we look at the TNX, we’re at 39 right now, but what’s important to me about this chart is take a look at it on a quarterly basis. So, I may have top ticked rates. In 1981, I came into this world, and it’s been a steady 40-year downtrend, right? From 81 until the incredibly fast, mean reversion of rates in 2020 and then they’ll push even higher. So, when we’re looking at the TNX, on a quarterly basis, it plummets. In 2020, we saw interest rates that we will never see again in this lifetime. But that was an inflection point, and when technical analysts are looking at very long-term trends, when you see something like this— a 40-year downtrend— that has been broken to the upside, that’s a secular shift. So yes, interest rates move higher or lower from day-to-day and from week to week, but we are sustainably above that downtrend line. And what we’re looking at is higher for longer, right? We’ve sort of meandered the last several months. If I take a look at sort of a weekly basis on that same chart, right, we climbed a lot higher very quickly in 2020 and 2021 and even through the first half of 2022. But we’ve been pretty stable since September of 2022. Rates have not been highly volatile. Yes, there is a lot of action; the two year was trading around this spring like cryptocurrency looked like. Bond market has been shattered by a lot of that extra volatility. But if you’re just looking at the TNX since about October of 2022, we’ve had this very range bound, very stable market. And I think for markets, in general, uncertainty is very difficult for investors to deal with, right, rates moving that quickly. The rate of change on a 10-year bond should not be skyrocketing the way it did over the last couple of years—that shakes investors. So, this stability has been really good, even though it is at elevated levels. And when you talk about the inflation narrative, we heard from Central Bankers that it was transitory. ‘This will pass.’ ‘This is just supply chain and logistics issues from COVID.’ They don’t actually know either, right? This is the, you know, this is their crystal ball. Turns out they were wrong. They were a little late to the game in trying to stem the rising tide of inflation. And then, of course, had to hike rates substantially and repeatedly to get some kind of control. That broke a few banks along the way. We had a liquidity event, not a solvency issue. What we’re seeing right now, in terms of yields, is just that stability, which I think is a big relief to investors. And what we’re seeing in terms of risk assets like equities performing so well— I think it’s because we’ve seen this stability in the interest rate environment.
Andrew Wilkinson
How’s the dollar looking?
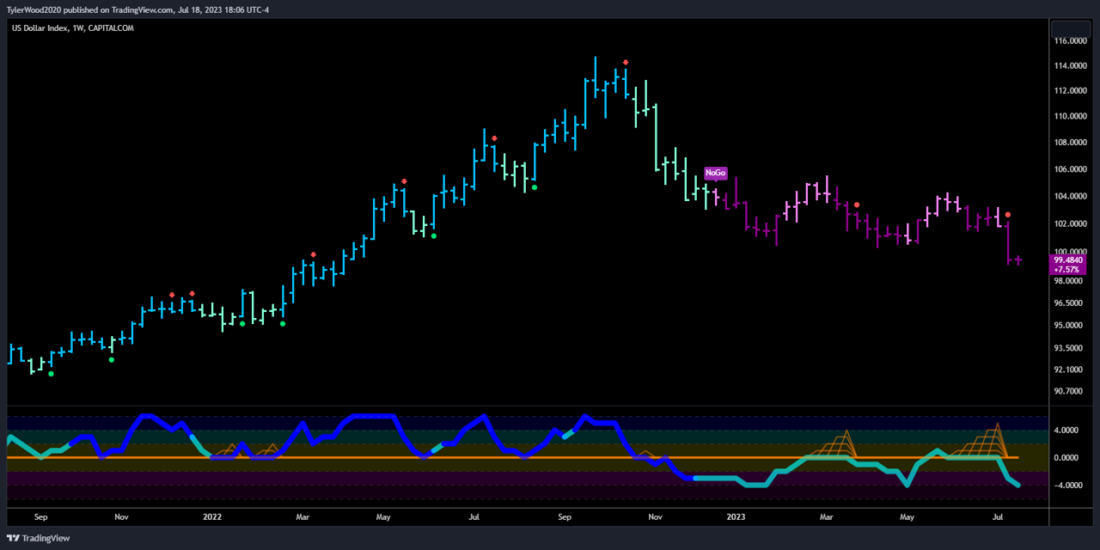
Tyler Wood
I know a lot of analysts were calling for the top at every major price level in 2022. Nobody thought it could go as high as it did. We’ve seen substantial retracement into 2023, right? We came off those highs very sharply. And if we’re looking at this on long term monthly bars or monthly candles, that’s also in a very stable range. The trend models that I look at have the U.S. dollar back in a rising uptrend, but we’re not seeing substantial new highs. We’re in kind of this range bound channel and I think that stability is also helpful to risk assets like equities, things, dollar denominated, right? If you’re investing in emerging markets that move in 2022 was really destructive. We saw a lot of impact from the strength in the U.S. dollar. I think if we stabilize here for some time through the rest of this year, that’s a very bullish signal to the markets that we’ve got stability in the currencies.
Andrew Wilkinson
And crude oil is one of the drivers of inflation. How’s that looking on the charts?
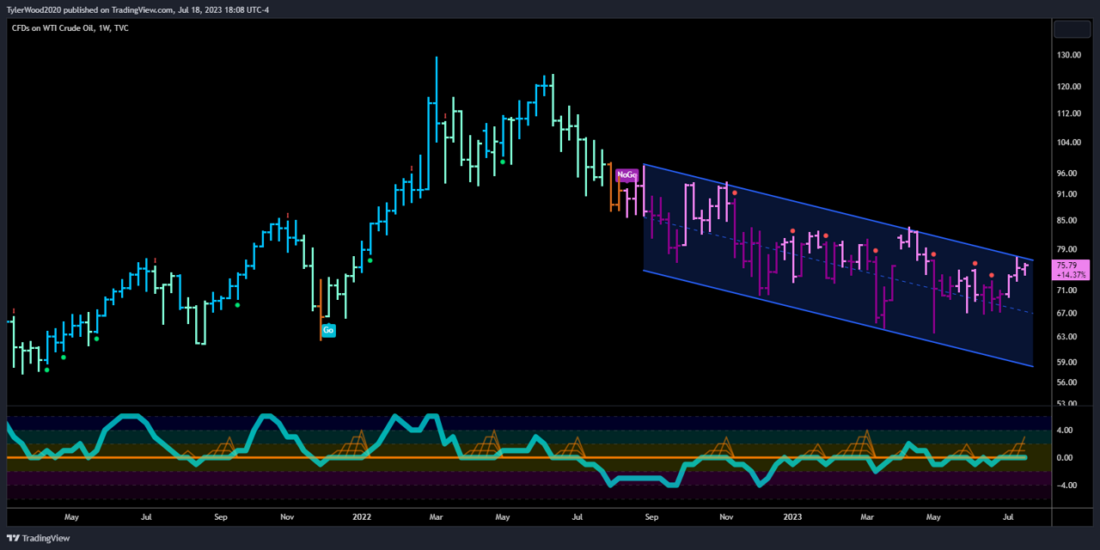
Tyler Wood
Well, I hate to sound like a broken record. We saw negative prices for barrels of oil in 2020. A lot of friends who trade for Trafigura and other energy space trading companies— I mean, it was their best trade ever. They’ve all retired in their late 30s now, from what happened to oil in 2021 and 2022. And what’s fascinating about technical analysis, to me, is that there’s going to be a trend somewhere. So, 2022, first half of the year, it was energy versus everything else, right, all being driven by these rising oil prices. And then we saw the U.S. dollar take over that trend and suddenly ‘the cash is trash’ phrase that was so popular on Wall Street— they all buttoned up their lips and went to strictly to cash. So as a technical analyst, you’ve got this comparative tool set that allows you to kind of go anywhere. I don’t know anything about upstream oil exploration, drilling, rigging, fracking— I have no idea, Andrew. But with a set of technical tools, you can be invested in a trend no matter what the industry is. And so, what we’re seeing in crude right now is just that stabilizing price channel, pretty narrow range and range bound trading is fairly positive for a lot of these markets. It allows some stability to come back in after years of volatility. So, on a weekly basis, we’re seeing it drift lower. This is not end days, you know, 65 bucks a barrel is— guess that’s just not so bad for the American public.
Andrew Wilkinson
And how relevant are gold prices these days?
Tyler Wood
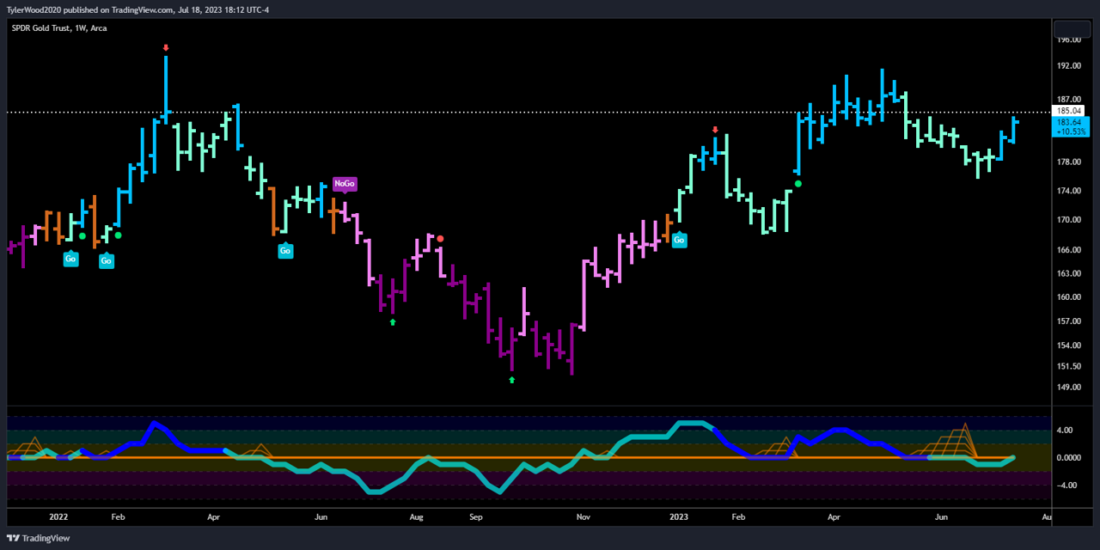
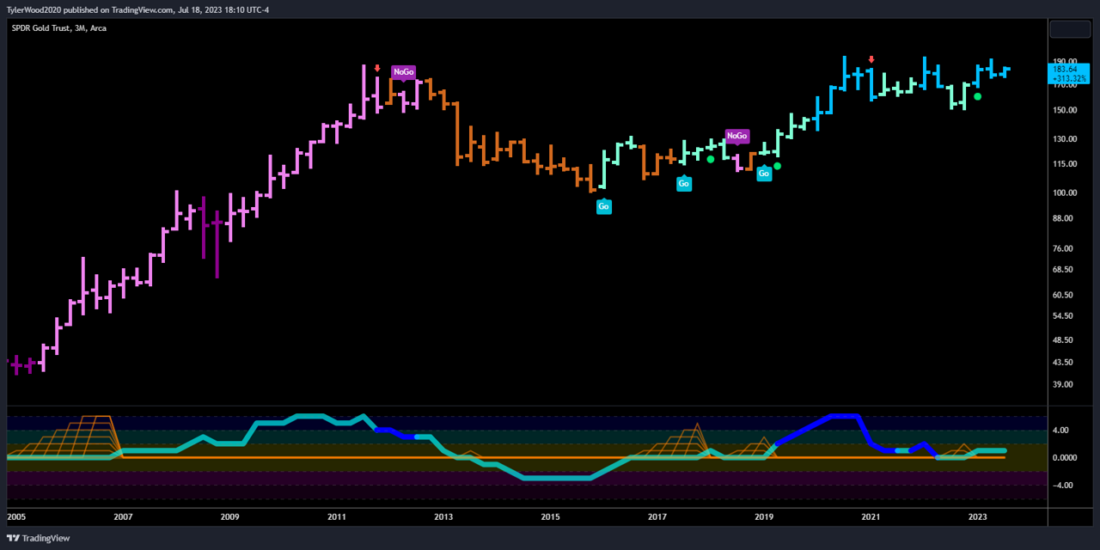
Coming back to that classical technical analysis, there’s a pattern that William O’Neill and Company and many others highlighted— called a ‘cup and handle’. I don’t know why these technicians give funny names to what they’re seeing on the chart, and anybody who wants to poke some jokes meet me at the comedy cellar; we’ll have a technical analysis night about Ichimoku and Itchy Scratchy charts and everything else. Cup and handle formation, all that means is that we made a new high, fell away from it, came back to test that new high again, fell away from it— smaller, so buyers stepped in at higher levels that second time after the test. The handle piece is just that idea— that now we have more demand for gold, right? Again, if we’re looking at this on a very long-term basis, a quarterly chart of gold going back decades, we can see that it was a nothing burger for investors from 2011 till about 2020. And we hit those highs and then it collapsed again. And all the textbooks that I went through in my MBA program told us that gold is a store of value and a flight to safety in a rising interest rate environment. I mean, I think I could find that textbook and pull out that phrase; it’s in every single book that’s ever been written about macroeconomics. However, gold wasn’t working, so again, there’s a narrative. There’s what we’ve been taught in school, and then there’s what the market is doing. And for me, the most important toolkit is being able to understand what the market is doing. So, we reached those highs in 2020. We came back to the exact same levels in 2022, and then fell away again. And so, throughout 2022, while everybody was assuming gold was going to be their best friend, they were making substantial losses and instead needed to be thinking about crude oil or the U.S. dollar or, you know, other things that were trending to the upside. What we’ve seen in 2023 is a regain of a lot of ground lost in 2022. What we’re seeing over the last several months, Andrew, is gold falling away yet again; we have not even reached those prior highs from 2020 or 2022. And it’s still in the trend models that I look at— still in a go trend on a weekly basis, right? If you’re looking a little longer term, but the gold trade, since April, has been down into the right, not doing a lot of favors for many portfolio managers.
Andrew Wilkinson
Let’s come back to equity prices. Where would market technicians agree are the risks and where are the opportunities by sector and industry at this point from an absolute perspective?
Tyler Wood
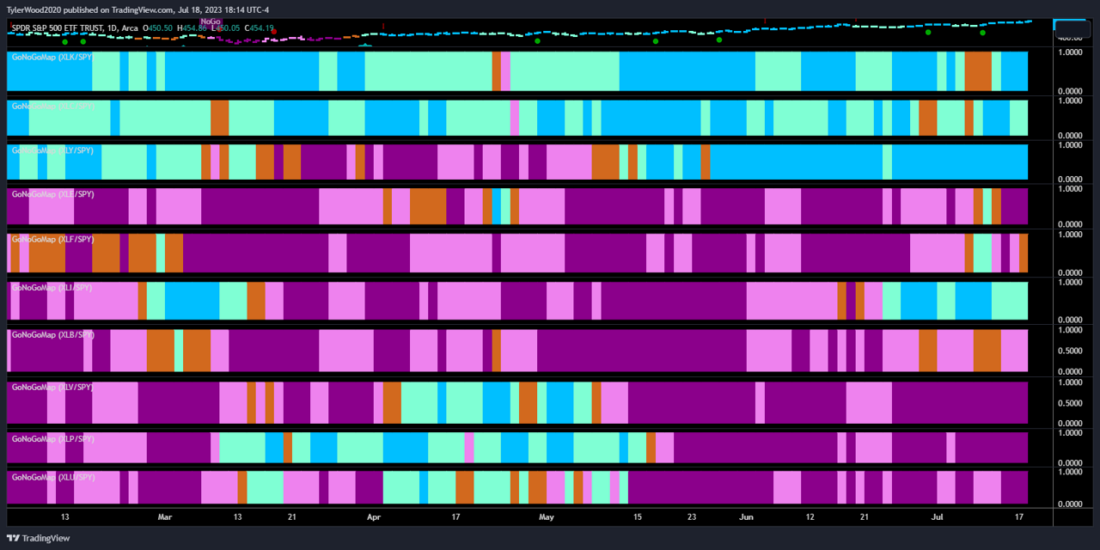
So, when we talked about, say, market of stocks, not just a single stock market. Technicians look at tools, breadth measures, right? Breadth is just looking at how many advancing shares there are in the equity index, and you want to see expanding breadth to have more confidence in the bull market. And that’s exactly what we’re seeing right now, at the end of the first half of 2023. What’s interesting stylistically, like if you think about the Morningstar nine boxes—if you’re looking at small mid and large cap and you’re looking at a mix of growth value or one or the other. In 2022, in that bear market, we saw decisive leadership coming out of our defensive and cyclical sectors. When I say defensive, I’m talking about utilities, consumer staples, healthcare. When we talk about the cyclical sectors of the stock market, we’re looking at materials, industrials, financials, and energy. Obviously, we’ve already talked about the energy trade. The XLE was actually the highest performing sector in 2021 going into the bear market of 2022. So, a lot of technical analysts are going to use this concept of relative strength. They’re going to compare the sectors against the benchmark. It’s just a very simple ratio. Martin Pring is one of the authors that appears throughout the CMT curriculum, and you’ll learn a lot about relative strength in the CMD program because it’s another really important comparative tool. And for portfolio managers, getting their sector bet right is almost as important, if not more important, than any of their individual security allocations. So, 2022 bear market, we saw defensive and cyclical sectors leading. And then we came into 2023, the first things to roll over were all the defensive sectors, consumer staples, utilities companies. They tanked on a relative basis to the S&P 500. Then we saw our cyclical sectors roll over, right? Obviously, the debacle and the financial sector, with regional banks imploding, we also saw the energy trade come off and even industrials and materials really took a back seat. And in 2023, since January, what has been leading the market higher? Remember, we’ve got a rising S&P 500, so the leadership on a relative basis is what is driving the market and it has been large cap growth names— the growth sectors being information technology, consumer discretionary and the communication sector. And so that was, you know, a fascinating look at investors turning back to the darlings of the stay-at-home Trade of 2020 and 2021. What was working— it was Facebook and Amazon and Netflix and Google and Microsoft because all of the technology that we needed to start working from home, people couldn’t travel, they were buying. It doesn’t matter why, but that’s what was the leading. And so, we came into 2023 and it’s those 3 sectors that have been outperforming the S&P 500: information technology, consumer, discretionary and communications. But I have some good news. Rotation, when the leadership moves from 1 sector to another, it’s creating breadth of expansion. And in the last few weeks we’ve seen industrials start to outperform the market. Some of the big gains for those large cap growth names have trailed off. We’re seeing a little bit of consolidation. And we’re seeing new leadership on a relative basis to the S&P, to me is so constructive and supportive to the thesis of a of a longer lasting bull market or resumption of the secular trend. A lot of great technical analysts and publishing research analysts have noted that you need to see that breath expansion. You need to see more sectors of the economy participating in that uptrend. So, it’s not just industrials— we’re seeing materials, we’re seeing some strength in other areas of the market—that’s just a welcome sign for a longer lasting bull market.
Andrew Wilkinson
And how about from a relative perspective, what does technical analysis reveal about the relative strength when comparing various investments?
Tyler Wood
Absolutely. That is perhaps the best tool for portfolio managers and even self-directed investors. When I think about my extended family, if they’re looking at their retirement accounts and even just toggling the dials, right, you don’t have to be a stock jockey, day trader. You could also control your investments just by rebalancing to the sector groups that are leading at any given time. And so, paying attention to what the market is telling us suggests that we need to be a little more overweight in things like industrials and materials because they are showing those signs of relative strength against a rising S&P 500. But it gets even better than that because we can dive a level deeper, right? Technical analysis, and this concept of relative strength, gives us a comparative study that we could use for anything. So, if you’re a currency trader and you’re looking at G10 pairs or you’re a commodities trader, you’re looking up and down agricultural minerals, industrial metals. You can use relative strength to find those trades that have the strongest performance. We won’t have time to go through all of the academic literature on the subject, but the idea of trend following or buying high momentum names is that what has been working over the last year tends to continue working. That’s where investment vehicles have delivered the best results for portfolio managers. So, when we look at relative strength on the sector groups, that’s a great place to start. But then we could get under the hood of the individual sector and do that same thing. So, if we were looking at industrials relative to SPX or you want to use ETF’s, that’s fine too. But if we’re just looking at the industrial sector, to the S&P 500, well now what areas of the industrial sector are outperforming that sector group; so we can get in even further and look at things like airlines, we can look at things like heavy construction—that are outperforming their sector group and that gives us, you know, that concept of you want to go fishing where the fish are right? You’re putting probabilities on your side by looking at things on this relative basis first or as part of your process. And for those who have fundamental long dated thesis on you know they expect materials companies to really outperform. You can look at U.S. steel or any steel manufacturer against the material sector and see that it is outperforming. That’s the concept of relative strength.
Andrew Wilkinson
What can be said about the rest of the world? Our overseas markets, following the lead of the U.S., where things are getting a little, well, I don’t about frothy, but you’ve painted a great picture of where we are with the equity markets. Where do global equity industries stand? And how are Latin American and European markets looking technically?
Tyler Wood
Timeframe matters. Over the last decade, we’ve seen, you know, the home bias is probably the first thing we should talk about. Investors all over the world, no matter where they’re located, tend to put much more of their capital into domestic equity names than anywhere else in the world, right? We just feel more comfortable. And for the U.S. investor that’s worked out really well. Because no nation on the planet has such a powerful information technology industry as the U.S. It’s all about Silicon Valley, and that’s what’s driven U.S. equity indices higher over the last 10 years. That’s been the place for value creation Now when you look at global equity indices again on that relative strength concept here in 2022/ 2023, we’re seeing outperformance. It was the U.K. and the eurozone that we’re outperforming towards the end of 2022, and they’ve come back this spring in 2023 outperforming. And just think about that— in the bear market, we said the sector groups that were leading were energy, financials, industrials and materials, cyclical sectors. Well, if you look at the construction of any nations index— Canada, I mean it’s mining companies, it’s energy. In Europe, they’ve got a ton of banks and a ton of industrials. That’s where capital was flowing. People much smarter than I were making the decisions on where to send institutional capital, and all I had to do was watch what they were doing. What’s fascinating to me in 2023, really looking at this on a relative basis as well, the Latin American countries, specifically Brazil, but we’ve also seen Colombia and we’ve seen Chile and Argentina outperforming the S&P 500. Keep in mind the S&P is rising, right? So, when we say outperforming, they’re doing better. An outperformer in a in a bear market might also be going down but going down less. That’s the concept of relative strength, again, but now we’re seeing that Latin American countries are outperforming Mexico is a real standout. Brazil is a real standout against even the U.S., which is a pretty dominant stock market.
Andrew Wilkinson
Fantastic stuff. Thank you very much. Tyler Woods, CMT managing director for joining me for this week’s podcast.
Tyler Wood
Absolutely, Andrew. Thank you very much for having me back on. Happy to talk markets anytime.
Andrew Wilkinson
All right. And folks, don’t forget to give us a rating wherever you download your podcast from, and we’ll see you again at IBKRpodcasts.com.
—
Related Terms
Disclosure: Interactive Brokers
The analysis in this material is provided for information only and is not and should not be construed as an offer to sell or the solicitation of an offer to buy any security. To the extent that this material discusses general market activity, industry or sector trends or other broad-based economic or political conditions, it should not be construed as research or investment advice. To the extent that it includes references to specific securities, commodities, currencies, or other instruments, those references do not constitute a recommendation by IBKR to buy, sell or hold such investments. This material does not and is not intended to take into account the particular financial conditions, investment objectives or requirements of individual customers. Before acting on this material, you should consider whether it is suitable for your particular circumstances and, as necessary, seek professional advice.
The views and opinions expressed herein are those of the author and do not necessarily reflect the views of Interactive Brokers, its affiliates, or its employees.
Disclosure: ETFs
Any discussion or mention of an ETF is not to be construed as recommendation, promotion or solicitation. All investors should review and consider associated investment risks, charges and expenses of the investment company or fund prior to investing. Before acting on this material, you should consider whether it is suitable for your particular circumstances and, as necessary, seek professional advice.
Disclosure: Forex
There is a substantial risk of loss in foreign exchange trading. The settlement date of foreign exchange trades can vary due to time zone differences and bank holidays. When trading across foreign exchange markets, this may necessitate borrowing funds to settle foreign exchange trades. The interest rate on borrowed funds must be considered when computing the cost of trades across multiple markets.
Disclosure: Bitcoin Futures
TRADING IN BITCOIN FUTURES IS ESPECIALLY RISKY AND IS ONLY FOR CLIENTS WITH A HIGH RISK TOLERANCE AND THE FINANCIAL ABILITY TO SUSTAIN LOSSES. More information about the risk of trading Bitcoin products can be found on the IBKR website. If you're new to bitcoin, or futures in general, see Introduction to Bitcoin Futures.
Disclosure: Futures Trading
Futures are not suitable for all investors. The amount you may lose may be greater than your initial investment. Before trading futures, please read the CFTC Risk Disclosure. A copy and additional information are available at ibkr.com.
Join The Conversation
If you have a general question, it may already be covered in our FAQs. If you have an account-specific question or concern, please reach out to Client Services.