


Key takeaways
Economy
US manufacturing shrank for the first time in two and a half years
Stocks
Bad news for the economy can be good news for stocks
Investors
Short-term chaos can create long-term opportunities
According to supply executives, the manufacturing side of the US economy contracted in November for the first time since May 2020. In other words, the US central bank – the Federal Reserve (Fed) – has finally succeeded in cooling down an overheated economy through restrictive financial conditions.
What does that mean for stocks?
Understandably, many investors may be inclined to sell stocks on such bad economic news. However, history suggests that could be a regrettable course of action. Contrary to popular belief, US stocks have generally enjoyed positive returns following the onset of manufacturing recessions.
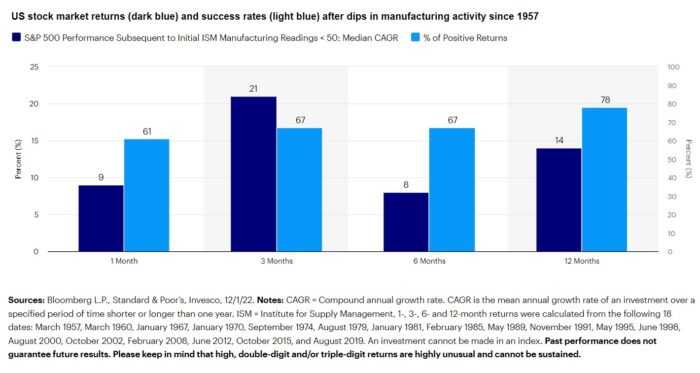
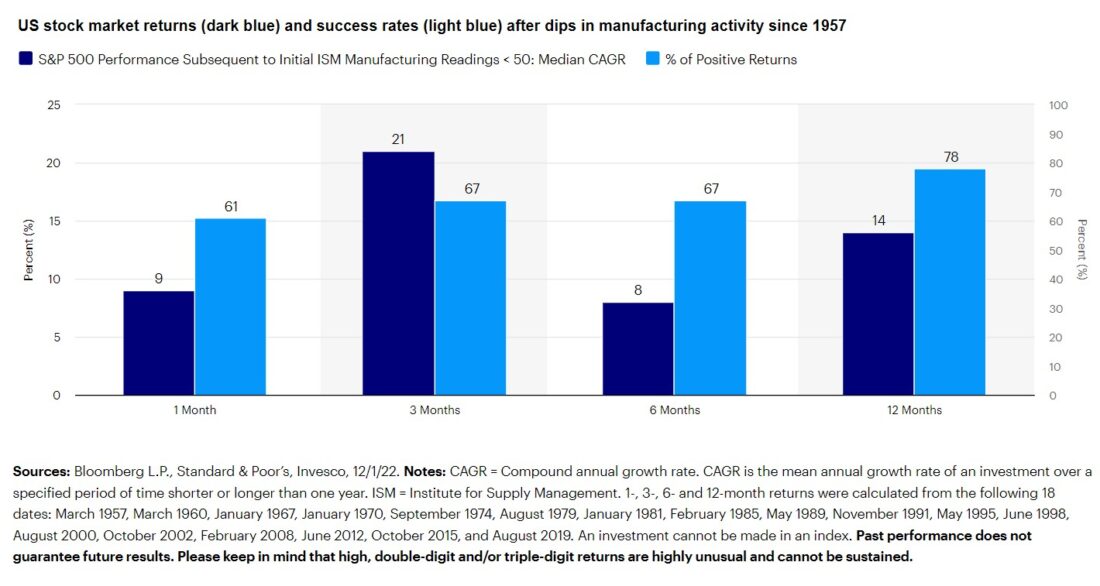
After dips in industrial activity since 1957 (or when the ISM Manufacturing Index fell below 50), the S&P 500 enjoyed double-digit returns three and 12 months onward. Moreover, the success rate or probability of generating a positive return increased the longer investors held on to their stocks (Figure 1).
Figure 1. Bad news for the economy can be good news for stocks
Contrary to popular belief, US stocks have enjoyed positive returns following the onset of manufacturing recessions, including double-digit returns three and 12 months afterward.
How’s that possible?
As I wrote in a recent blog, the delayed relationship between stocks and gross domestic product (GDP) argues that a market rally in the present could be followed by an economic recovery about half a year in the future.
While more economic and earnings challenges may lie ahead of us, in my view, investors shouldn’t let that distract them. Rather, enlightened investors should prepare for a market recovery first and an economic recovery second.
Are we drawing the right conclusions?
As a paranoid analyst, I question my assumptions. That healthy process can help sharpen the tools in any investor’s kit. For example, are we looking at the right mix of indicators and are we interpreting them correctly?
True, my technical checklist of market bottom indicators worked well in real-time back in early 2020, and it did a decent job of gauging the duration and magnitude of stock-market drawdowns this year.
While we’ve made a lot of progress, perhaps I was wrong to assume peak fear would manifest in the Chicago Board Options Exchange (CBOE) Volatility Index (VIX) and the Bloomberg US Corporate High Yield average option-adjusted spread, which have remained reasonably well-behaved.
When the Fed tightens financial conditions, things start to break. Indeed, the latest cryptocurrency debacle may well have been the ultimate credit event I was expecting in the current market cycle. That’s important because the cryptocurrency exchanges probably aren’t captured in the high-yield bond indices. Said differently, relatively narrow corporate bond spreads above their Treasury counterparts may be a testament to the fundamental strength of some of those below-investment grade businesses.
Is investor risk aversion good or bad for stocks?
Fortunately, there’s a way to remove some of the human element from the investment decision-making process and to avoid cherry-picking the indicators. Specifically, I introduced a level of statistical significance to my eight tactical indicators by combining and expressing them in common units of standard deviations away from their mean or average.
Few of my readers likely know that sigma is the 18th letter of the Greek alphabet, myself included before I searched it on the internet. However, variability’s a concept we all understand and experience in our lives on a daily basis. Stock market investors have certainly been on a roller coaster ride in 2022!
In fact, investor risk aversion experienced a two-and-a-half sigma or statistically significant event in late September, driven mostly by a low percentage of New York Stock Exchange (NYSE) stocks above their 200-day moving averages, an inverted American Association of Individual Investors (AAII) Sentiment Survey Bull-Bear Spread, and a high CBOE Equity Put/Call (P/C) Ratio (Figure 2).
Figure 2. Short-term chaos can create long-term opportunities
Peak fear has usually coincided with major troughs in the US stock market.
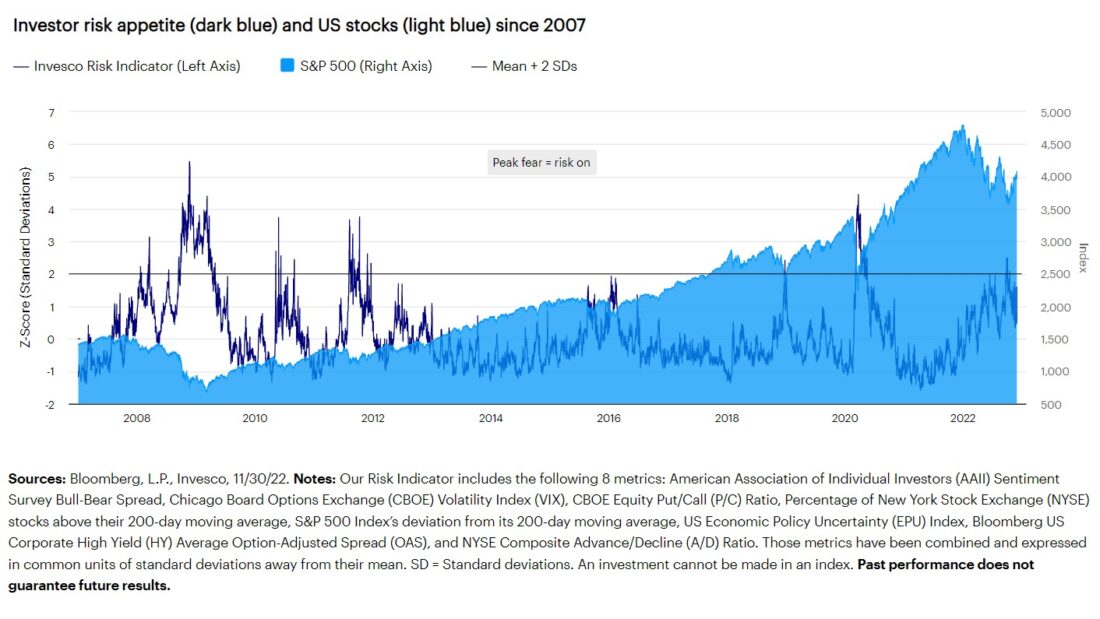
From a contrarian perspective, peak fear – which has usually coincided with major troughs in US stocks – at that time explains the setup for the 8.1% return we saw in October, which was the 11th best month for the S&P 500 Index we’ve seen in 35 years!1
Admittedly, investor risk aversion in 2022 hasn’t been as high as it was back in the Great Shutdown of early 2020 or the Great Recession of 2007-2009, which were massive market dislocations and more than four-sigma events.
Nonetheless, proverbial blood in the streets and significant damage in stocks get me excited as a contrarian. We’re in this together, and after double-digit drawdowns, I think most investors would welcome the transition from contraction to recovery.
Footnotes
- 1Source: Bloomberg, L.P.
—
Originally Posted December 7, 2022
Are business cycle contractions good or bad for stocks? by Invesco US
Important information
NA 2620246
This does not constitute a recommendation of any investment strategy or product for a particular investor. Investors should consult a financial professional before making any investment decisions.
All investing involves risk, including the risk of loss.
Diversification does not guarantee a profit or eliminate the risk of loss.
Past performance does not guarantee future results.
Investments cannot be made directly in an index.
In general, stock values fluctuate, sometimes widely, in response to activities specific to the company as well as general market, economic and political conditions.
Fixed income investments are subject to credit risk of the issuer and the effects of changing interest rates. Interest rate risk refers to the risk that bond prices generally fall as interest rates rise and vice versa. An issuer may be unable to meet interest and/or principal payments, thereby causing its instruments to decrease in value and lowering the issuer’s credit rating.
The ISM Manufacturing Index, which is based on Institute of Supply Management surveys of manufacturing firms in the US, monitors employment, production, inventories, new orders and supplier deliveries.
The Chicago Board Options Exchange Volatility Index®, or VIX, is a key measure of market expectations of near-term volatility conveyed by S&P 500 stock index option prices.
The Bloomberg US Corporate High Yield average option-adjusted spread measures the spread of US dollar-denominated, below investment-grade, fixed-rate corporate bonds above their Treasury counterparts. When the spread is wide, investors demand high compensation for taking risk.
The American Association of Individual Investors Bull-Bear Spread is the net percentage of positive minus negative respondents to the association’s sentiment survey.
The Chicago Board Options Exchange Equity Put/Call Ratio is a measure of seller relative to buyer positioning derived from the options market.
The Economic Policy Uncertainty Index utilizes US newspaper archives to gauge the level of policy-related economic uncertainty.
Standard deviation, or sigma, measures a range of total returns in comparison to the mean.
Spread represents the difference between the yield on a corporate bond and a similar maturity US Treasury bond.
Gross domestic product is a broad indicator of a region’s economic activity, measuring the monetary value of all the finished goods and services produced in that region over a specified period of time.
The opinions referenced above are those of the author as of Dec. 1, 2022. These comments should not be construed as recommendations, but as an illustration of broader themes. Forward-looking statements are not guarantees of future results. They involve risks, uncertainties and assumptions; there can be no assurance that actual results will not differ materially from expectations.
Disclosure: Invesco US
This does not constitute a recommendation of any investment strategy or product for a particular investor. Investors should consult a financial advisor/financial consultant before making any investment decisions. Invesco does not provide tax advice. The tax information contained herein is general and is not exhaustive by nature. Federal and state tax laws are complex and constantly changing. Investors should always consult their own legal or tax professional for information concerning their individual situation. The opinions expressed are those of the authors, are based on current market conditions and are subject to change without notice. These opinions may differ from those of other Invesco investment professionals.
NOT FDIC INSURED
MAY LOSE VALUE
NO BANK GUARANTEE
All data provided by Invesco unless otherwise noted.
Invesco Distributors, Inc. is the US distributor for Invesco Ltd.’s Retail Products and Collective Trust Funds. Institutional Separate Accounts and Separately Managed Accounts are offered by affiliated investment advisers, which provide investment advisory services and do not sell securities. These firms, like Invesco Distributors, Inc., are indirect, wholly owned subsidiaries of Invesco Ltd.
©2024 Invesco Ltd. All rights reserved.
Disclosure: Interactive Brokers
Information posted on IBKR Campus that is provided by third-parties does NOT constitute a recommendation that you should contract for the services of that third party. Third-party participants who contribute to IBKR Campus are independent of Interactive Brokers and Interactive Brokers does not make any representations or warranties concerning the services offered, their past or future performance, or the accuracy of the information provided by the third party. Past performance is no guarantee of future results.
This material is from Invesco US and is being posted with its permission. The views expressed in this material are solely those of the author and/or Invesco US and Interactive Brokers is not endorsing or recommending any investment or trading discussed in the material. This material is not and should not be construed as an offer to buy or sell any security. It should not be construed as research or investment advice or a recommendation to buy, sell or hold any security or commodity. This material does not and is not intended to take into account the particular financial conditions, investment objectives or requirements of individual customers. Before acting on this material, you should consider whether it is suitable for your particular circumstances and, as necessary, seek professional advice.


