


CMT Association’s Market Insights features timely technical analysis of current global markets by veteran CMT charterholders. Each post appears on www.tradingview.com/u/CMT_Association/ in an effort to explain process, tools, and the responsible practice of technical analysis. Shared content and posted charts are intended to be used for informational and educational purposes only. The CMT Association does not offer, and this information shall not be understood or construed as, financial advice or investment recommendations. The information provided is not a substitute for advice from an investment professional. The CMT Association does not accept liability for any financial loss or damage our audience may incur.
I begin each year reviewing the long term technical positions of the “Big Four.” 10 Year rates, SPX, Commodities, and the US Dollar. Since by profession I am a rates/credit portfolio manager and trader, I always start with rates. Granted, macro doesn’t typically impact shorter term (swing, daily and weekly) trading, but having a framework for markets and for recognizing change is important. Last year’s thoughts, including extensive fundamental background, are linked.
In this piece I will recap my views on the monthly chart and follow next week with my view on the weekly chart and conclusions.
A reminder that falling bond yields are synonymous with higher bond prices. In other words, a downtrend in yield = a bull market in bonds.
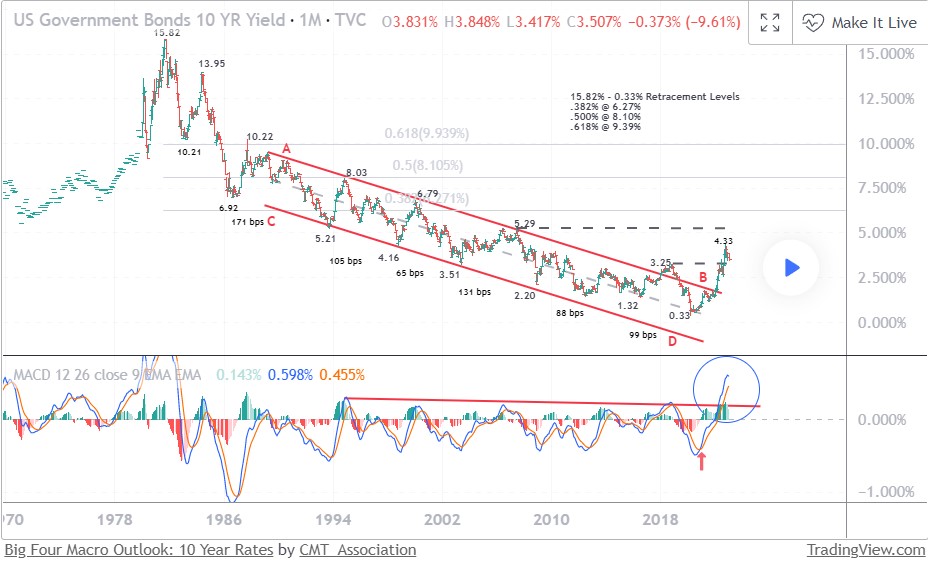
Over the last four decades bonds had consistently and reliably made lower highs and lower lows. The entire bull market was defined by a broad declining channel (A-B, C-D). The A-B downtrend line represented the “stride of demand” or the zone where buyers consistently emerged and the C-D line represented the “overbought line” or the zone where supply consistently emerged.
From 2012 forward there were growing signs that the long downtrend was aging. Four things stood out. 1) The repeated failure to push to the oversold line (C-D). 2) The flattening out of the decline where each push to a new yield low only covered around 100 bps . 3) The 2018 spike to 3.25% that weakened the primary A-B downtrend. 4) In March of 2020 bonds pushed to the area around the center of the channel, and again failed to push into the overbought line (C-D), suggesting that demand was tiring. These very visible change of behavior strongly suggested that the 40 year downtrend was in danger.
Now, the clear break and acceleration above the A-B downtrend has moved the long trend from bullish to neutral. While it’s likely that the move above November 2018 pivot @ 3.25% coupled with the changes of behavior mark the beginning of a long term bear market, a higher low (perhaps forming over the first half of 2023) is needed to complete/confirm that change.
Note the additional changes in behavior. The 400 bps move from 0.33% to 4.33% represents the single largest bearish move since the inception of the bull market in September 1981 and the current MACD oscillator level has far exceeded the levels that marked yield highs over the course of the entire bull market.
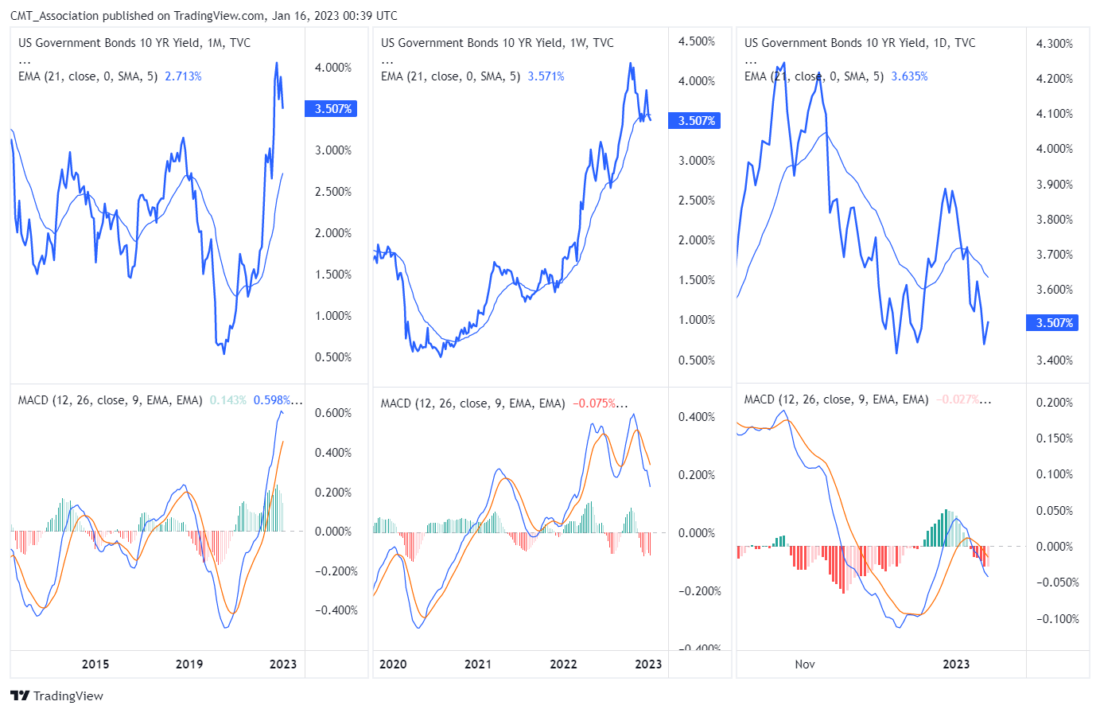
Triple Screen: Daily, Weekly, Monthly:
There are several key fundamental points around rates:
-The defining macro characteristic of the 40 year bull market has been the continual fall in the inflation rate. If that is changing, the secular bond trend is likely to also change.
-If the trend in inflation is changing, the negative correlation between bonds and equity that drives 60/ 40 allocation and risk parity investing is likely to flip and become positive. In other words, bonds and equity would, outside of periods of panic, rise and fall together destroying the diversification benefit. This has been the historical norm and I expect that the market will gradually move in that direction.
-The caveat being this: Quantitative easing removed the value proposition from bonds, when equities began to decline this year bonds COULDN’T provide a safe haven… they were already far too expensive, particularly in context of a Federal Reserve that was aggressively tightening monetary policy , that is no longer the case. Bonds, while still expensive can again provide a tactical hedge should risk assets weaken dramatically.
-At first glance, this seems at odds with the with the change in correlation discussed above, but it is a difference between the secular tide verses the intermediate wave.
-Most substantive bond rallies have been the result of a crisis that created a flight to quality. In an economy that is overly financialized and levered, rising rates often break the weakest link in the economic chain, creating a new crisis and a subsequent flight to quality rally. While so far, there is little evidence of a systemic crisis, the lagged effect of the rapid increase in rates in an overly financialized system demands attention.
Bottom Line: While there is still more work to be done to confirm the trend change, I believe the bond trend is finally changing as the world moves from the deflationary backdrop of the last several decades to an inflationary backdrop. I will be a much better seller of rallies and bearish technical setups in the weekly/intermediate perspective.
—
Originally Posted January 16, 2023 – Big Four Macro Outlook: 10 Year Rates
Shared content and posted charts are intended to be used for informational and educational purposes only. The CMT Association does not offer, and this information shall not be understood or construed as, financial advice or investment recommendations. The information provided is not a substitute for advice from an investment professional. The CMT Association does not accept liability for any financial loss or damage our audience may incur.
Disclosure: CMT Association
Shared content and posted charts are intended to be used for informational and educational purposes only. The CMT Association does not offer, and this information shall not be understood or construed as, financial advice or investment recommendations. The information provided is not a substitute for advice from an investment professional. The CMT Association does not accept liability for any financial loss or damage our audience may incur.
Disclosure: Interactive Brokers
Information posted on IBKR Campus that is provided by third-parties does NOT constitute a recommendation that you should contract for the services of that third party. Third-party participants who contribute to IBKR Campus are independent of Interactive Brokers and Interactive Brokers does not make any representations or warranties concerning the services offered, their past or future performance, or the accuracy of the information provided by the third party. Past performance is no guarantee of future results.
This material is from CMT Association and is being posted with its permission. The views expressed in this material are solely those of the author and/or CMT Association and Interactive Brokers is not endorsing or recommending any investment or trading discussed in the material. This material is not and should not be construed as an offer to buy or sell any security. It should not be construed as research or investment advice or a recommendation to buy, sell or hold any security or commodity. This material does not and is not intended to take into account the particular financial conditions, investment objectives or requirements of individual customers. Before acting on this material, you should consider whether it is suitable for your particular circumstances and, as necessary, seek professional advice.


