


By J.C. Parets & All Star Charts
Tuesday, 3rd January, 2023
1/ Strong Seasonal Tailwinds for DXY
2/ Gold Bests Bonds
3/ Small Over Large for Growth Stocks
4/ Still a Bear Market for BTC
Investopedia is partnering with All Star Charts on this newsletter, which both sells its research to investors, and may trade or hold positions in securities mentioned herein. The contents of this newsletter are for informational and educational purposes only, however, and do not constitute investing advice.
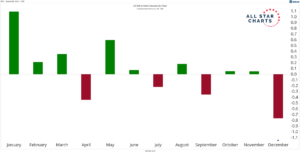
1/ Strong Seasonal Tailwinds for DXY
Today’s broad U.S. dollar rally shouldn’t come as a surprise. From a seasonal perspective, January represents the strongest month for the USD. February and March also tend to be favorable for the greenback. Here is the historical performance of the U.S. Dollar Index (DXY) broken down by month:

The dollar is entering its best three-month stretch of the year, historically. But this doesn’t mean that the dollar is guaranteed to rise.
Instead, seasonality acts as a roadmap, providing the context for a particular market by observing past behavior. It’s especially important to understand the seasonal tailwinds and headwinds for any given market at potential inflection points. As we’ve written before, the DXY is testing a logical area of resistance. How it responds to those levels and whether it respects its seasonality could provide valuable information for the year ahead.
2/ Gold Bests Bonds
Assets in strong uptrends don’t just do well on an absolute basis. They also tend to outperform their alternatives.
We expect no difference from gold if it breaks to fresh all-time highs. That means gold is completing a massive base relative to bonds.
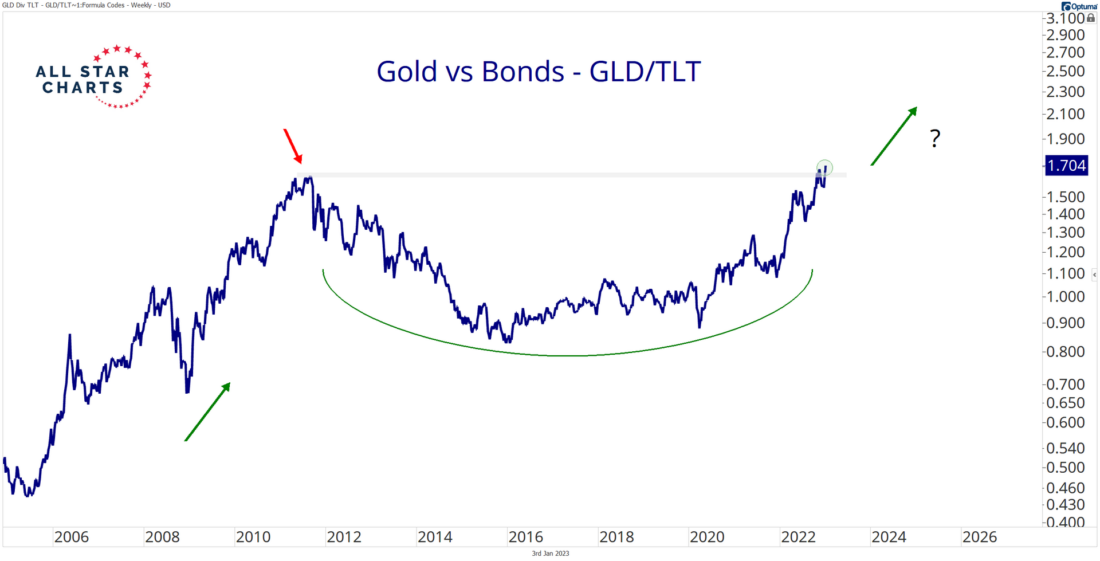
The gold ETF (GLD) versus long-duration U.S. Treasury Bond ETF (TLT) ratio is breaking out of a decade-long bottoming formation that appears similar to an absolute price chart of gold.
A sustained upside resolution in this key intermarket ratio is at the top of our checklist for the next structural uptrend in gold. Any breakout in gold on an absolute basis could be considered suspect if this breakout relative to bonds fails to hold. So far, precious metals continue to exhibit strength on absolute and relative terms as gold bugs come out of the woodwork.
3/ Small Over Large for Growth Stocks
When it comes to growth stocks these days, not all are created equal. While mega-cap growth and tech names remain under serious selling pressure with many making new lows, many of their small-cap counterparts bottomed last summer and have been carving out bottoms ever since. The Invesco Small Cap Technology ETF (PSCT), shown relative to the Vanguard Mega Cap Growth ETF (MGK) in the chart below, provides a great example of an index of growth stocks that is showing resilience.
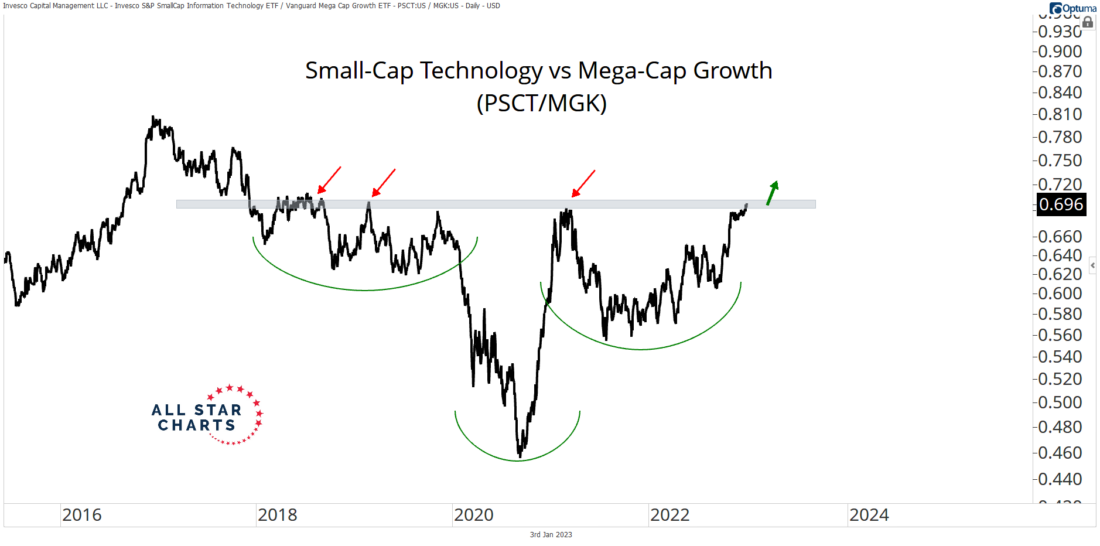
While PSCT has pulled back in recent weeks, unlike large-cap growth indexes, it is nowhere near its pivot lows. This outperformance is also illustrated by the ramp up in the ratio chart, above. With PSCT challenging to break out from a reversal pattern to fresh multi-year highs versus MGK, this trend may just be getting started. If we get a valid upside resolution in PSCT/MGK, it could foreshadow further leadership from smaller growth stocks for the foreseeable future.
4/ Still a Bear Market for BTC
When it comes to cryptocurrencies, Bitcoin closed in the red every quarter of last year. ThWhen it comes to cryptocurrencies, Bitcoin closed in the red every quarter of last year. That’s the longest consecutive tally of quarterly losses in Bitcoin’s price history.at’s the longest consecutive tally of quarterly losses in Bitcoin’s price history.
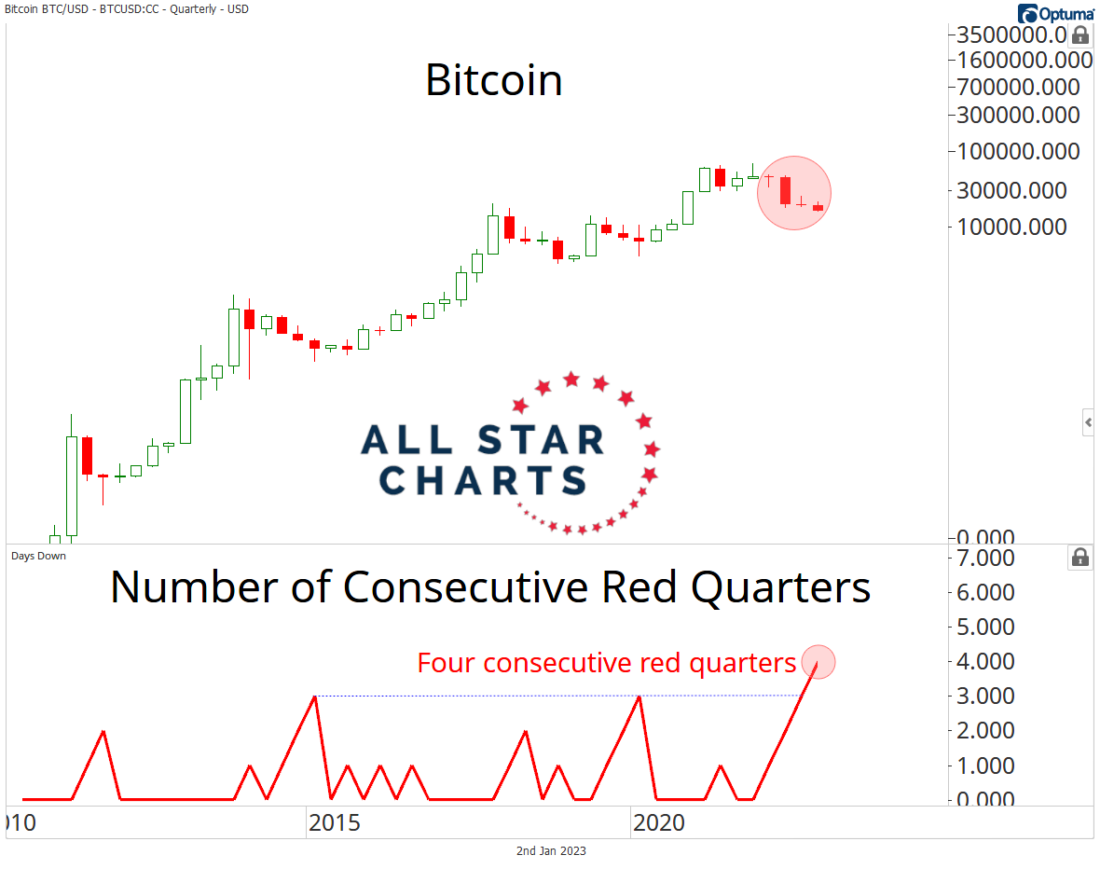
This tells us that the bear market for Bitcoin is still alive and well. Whether or not it can break this trend here and find a bottom, as it did following past losing streaks, is yet to be seen. Price is showing no signs of it just yet.
—
Originally posted 3rd January 2023
Disclosure: Investopedia
Investopedia.com: The comments, opinions and analyses expressed herein are for informational purposes only and should not be considered individual investment advice or recommendations to invest in any security or to adopt any investment strategy. While we believe the information provided herein is reliable, we do not warrant its accuracy or completeness. The views and strategies described on our content may not be suitable for all investors. Because market and economic conditions are subject to rapid change, all comments, opinions and analyses contained within our content are rendered as of the date of the posting and may change without notice. The material is not intended as a complete analysis of every material fact regarding any country, region, market, industry, investment or strategy. This information is intended for US residents only.
Disclosure: Interactive Brokers
Information posted on IBKR Campus that is provided by third-parties does NOT constitute a recommendation that you should contract for the services of that third party. Third-party participants who contribute to IBKR Campus are independent of Interactive Brokers and Interactive Brokers does not make any representations or warranties concerning the services offered, their past or future performance, or the accuracy of the information provided by the third party. Past performance is no guarantee of future results.
This material is from Investopedia and is being posted with its permission. The views expressed in this material are solely those of the author and/or Investopedia and Interactive Brokers is not endorsing or recommending any investment or trading discussed in the material. This material is not and should not be construed as an offer to buy or sell any security. It should not be construed as research or investment advice or a recommendation to buy, sell or hold any security or commodity. This material does not and is not intended to take into account the particular financial conditions, investment objectives or requirements of individual customers. Before acting on this material, you should consider whether it is suitable for your particular circumstances and, as necessary, seek professional advice.
Disclosure: ETFs
Any discussion or mention of an ETF is not to be construed as recommendation, promotion or solicitation. All investors should review and consider associated investment risks, charges and expenses of the investment company or fund prior to investing. Before acting on this material, you should consider whether it is suitable for your particular circumstances and, as necessary, seek professional advice.
Disclosure: Forex
There is a substantial risk of loss in foreign exchange trading. The settlement date of foreign exchange trades can vary due to time zone differences and bank holidays. When trading across foreign exchange markets, this may necessitate borrowing funds to settle foreign exchange trades. The interest rate on borrowed funds must be considered when computing the cost of trades across multiple markets.
Disclosure: Bitcoin Futures
TRADING IN BITCOIN FUTURES IS ESPECIALLY RISKY AND IS ONLY FOR CLIENTS WITH A HIGH RISK TOLERANCE AND THE FINANCIAL ABILITY TO SUSTAIN LOSSES. More information about the risk of trading Bitcoin products can be found on the IBKR website. If you're new to bitcoin, or futures in general, see Introduction to Bitcoin Futures.
Disclosure: Futures Trading
Futures are not suitable for all investors. The amount you may lose may be greater than your initial investment. Before trading futures, please read the CFTC Risk Disclosure. A copy and additional information are available at ibkr.com.
Disclosure: Bitcoin Futures
TRADING IN BITCOIN FUTURES IS ESPECIALLY RISKY AND IS ONLY FOR CLIENTS WITH A HIGH RISK TOLERANCE AND THE FINANCIAL ABILITY TO SUSTAIN LOSSES. More information about the risk of trading Bitcoin products can be found on the IBKR website. If you're new to bitcoin, or futures in general, see Introduction to Bitcoin Futures.


