


By J.C. Parets & All Star Charts
Monday, 19th December, 2022
1/ Micro Caps Melt Down
2/ Bear Market Base
3/ Breakevens Break Down
4/ Sugar Futures Look Sweet
Investopedia is partnering with All Star Charts on this newsletter, which both sells its research to investors, and may trade or hold positions in securities mentioned herein. The contents of this newsletter are for informational and educational purposes only, however, and do not constitute investing advice.
1/ Micro Caps Melt Down
While mid caps are outperforming large caps, small and micro caps have severely underperformed since the beginning of November. When we look for information about when and where the major averages might find support, we can use the iShares Micro-Cap ETF (IWC) for an early indication, as the index could be the first to break down due to its relative weakness.

This daily line chart of IWC shows price heading back toward the same level of support from June and September. Notice how this key polarity zone also coincides with the pre-pandemic crash peak in early 2020, just north of 100.
We’re watching micro caps closely to see if this former resistance level will once again become support. However, as this is now the third test of this level, a violation to the downside should not come as any surprise.
2/ Bear Market Base
We’ve been writing about the relative strength from defensive stocks in the past few weeks. Low-volatility stocks are a great example of this theme.
When they are rallying on a relative basis, the broader market tends to be under pressure. As you can see from the chart below, this has been the case since last year.

Today, the relative trend of low volatility stocks versus the S&P 500 (SPLV/SPY) closed at its highest level in roughly two and a half years as the ratio looks poised to resolve higher from a rounding bottom pattern.
Seeing this ratio complete a bearish-to-bullish reversal suggests risk assets could remain under pressure, as an increasingly risk-off tone grips markets.
3/ Breakevens Break Down
Instead of guessing the future direction of inflation, let’s break down where it’s been and where it is today. The 10-year breakeven inflation rate peaked in April and has been heading lower since, closing below its prior-cycle highs last week, which coincide with the 2018 peak.
Whether the Fed has fully defeated inflation remains unseen, but the 10-year breakevens are printing their lowest level in nearly two years.
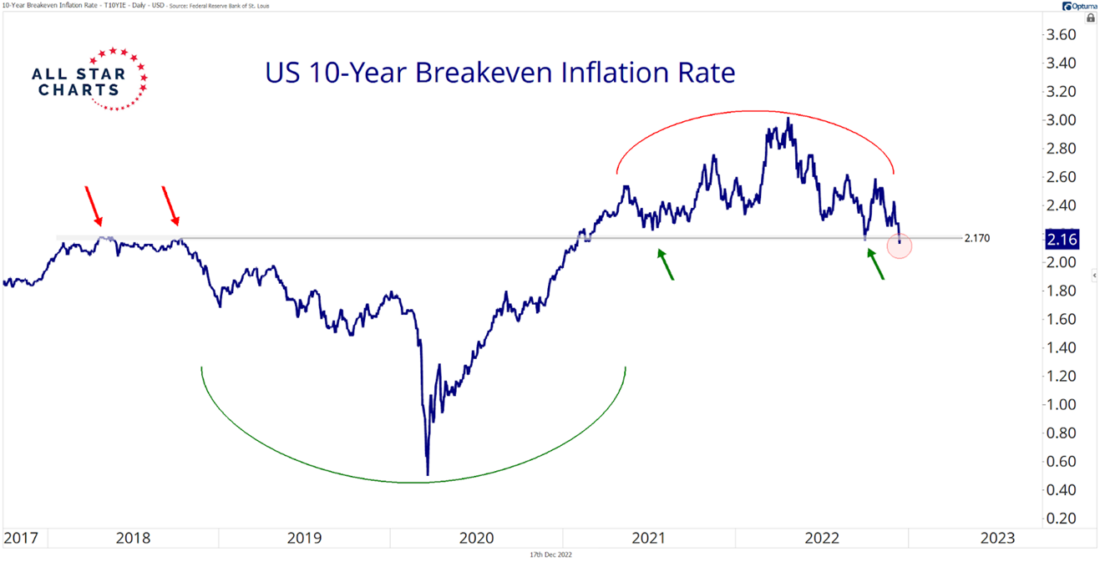
This chart looks eerily similar to crude oil and gasoline futures, as both pro-cyclical commodities have undercut their prior-cycle highs. As long as inflation expectations continue to trend lower, inflationary assets such as commodities could do the same.
Selling pressure continues to pick up as risk assets across the board turn lower. The markets continue to present challenging conditions that demand caution.
4/ Sugar Futures Look Sweet
While breakevens roll over with energy contracts such as crude and gasoline, other commodities could be ready for potential rallies heading into the new year. Many of these contracts belong to more defensive areas in the agricultural space, such as softs or grains.
For example, sugar futures are trading within a tight range as momentum recently hit overbought conditions.

Momentum often leads price, providing valuable insight into whether bulls or bears hold court. This time could be no different, but we would like to see another bullish momentum reading on a decisive upside resolution as confirmation.
The bullish patterns in agricultural commodity futures remind us that inflation remains elevated, and less economically-sensitive assets could provide investors with the best long opportunities over the coming weeks and months.
—
Originally posted 19th December 2022
Disclosure: Investopedia
Investopedia.com: The comments, opinions and analyses expressed herein are for informational purposes only and should not be considered individual investment advice or recommendations to invest in any security or to adopt any investment strategy. While we believe the information provided herein is reliable, we do not warrant its accuracy or completeness. The views and strategies described on our content may not be suitable for all investors. Because market and economic conditions are subject to rapid change, all comments, opinions and analyses contained within our content are rendered as of the date of the posting and may change without notice. The material is not intended as a complete analysis of every material fact regarding any country, region, market, industry, investment or strategy. This information is intended for US residents only.
Disclosure: Interactive Brokers
Information posted on IBKR Campus that is provided by third-parties does NOT constitute a recommendation that you should contract for the services of that third party. Third-party participants who contribute to IBKR Campus are independent of Interactive Brokers and Interactive Brokers does not make any representations or warranties concerning the services offered, their past or future performance, or the accuracy of the information provided by the third party. Past performance is no guarantee of future results.
This material is from Investopedia and is being posted with its permission. The views expressed in this material are solely those of the author and/or Investopedia and Interactive Brokers is not endorsing or recommending any investment or trading discussed in the material. This material is not and should not be construed as an offer to buy or sell any security. It should not be construed as research or investment advice or a recommendation to buy, sell or hold any security or commodity. This material does not and is not intended to take into account the particular financial conditions, investment objectives or requirements of individual customers. Before acting on this material, you should consider whether it is suitable for your particular circumstances and, as necessary, seek professional advice.
Disclosure: ETFs
Any discussion or mention of an ETF is not to be construed as recommendation, promotion or solicitation. All investors should review and consider associated investment risks, charges and expenses of the investment company or fund prior to investing. Before acting on this material, you should consider whether it is suitable for your particular circumstances and, as necessary, seek professional advice.
Disclosure: Futures Trading
Futures are not suitable for all investors. The amount you may lose may be greater than your initial investment. Before trading futures, please read the CFTC Risk Disclosure. A copy and additional information are available at ibkr.com.


