


By J.C. Parets & All Star Charts
1/ Industrials Continue to Shine
2/ Copper Coils
3/ McDonald’s Bulls Are Lovin’ It
4/ Cryptocurrencies Test Summer Highs
Investopedia is partnering with All Star Charts on this newsletter, which both sells its research to investors, and may trade or hold positions in securities mentioned herein. The contents of this newsletter are for informational and educational purposes only, however, and do not constitute investing advice.
1/ Industrials Continue to Shine
We’ve been emphasizing the relative strength from small caps in recent weeks. We’ve also been discussing the leadership from industrials.
The chart below shows small-cap industrials (PSCI) breaking out of a continuation pattern and reaching new all-time highs relative to the Russell 2000 (IWM).

Whether we are looking at small or large-cap stocks, the relative trends are resolving higher and accelerating in favor of industrials.
As long as the breakout in the PSCI/IWM ratio continues, we could expect industrial stocks to continue outperforming their small-cap peers over the near term.
2/ Copper Coils
As markets focused on the FOMC‘s interest rate decision, copper futures quietly consolidated above a critical level of former resistance.
Last June, copper futures broke down from a 12-month topping formation. The breakdown resulted in a steep selloff that retested copper’s prior-cycle highs from 2018.

As you can see, copper found support at this critical polarity zone as prices have stabilized in a sideways trading range since the summer. Copper is now coiling within a tight consolidation at a critical inflection point.
If the current congestion proves to be a continuation pattern, a downside resolution might not bode well for the economy and risk assets.
On the other hand, an upside breakout in copper could signal improving fundamentals for the global economy, and imply that investors are once again reaching for risk.
3/ McDonald’s Bulls Are Lovin’ It
The Dow Jones Industrial Average (DJIA) has taken on a clear leadership role as it continues to outperform its large-cap counterparts, including the S&P 500 and Nasdaq Composite. This isn’t just taking place on a relative basis, as several component stocks are starting to break out to new highs on absolute terms as well.
McDonald’s (MCD) is among the Dow constituents that notched a new high this week. Here is MCD charted relative to the Dow Jones Industrial Average (DIA):
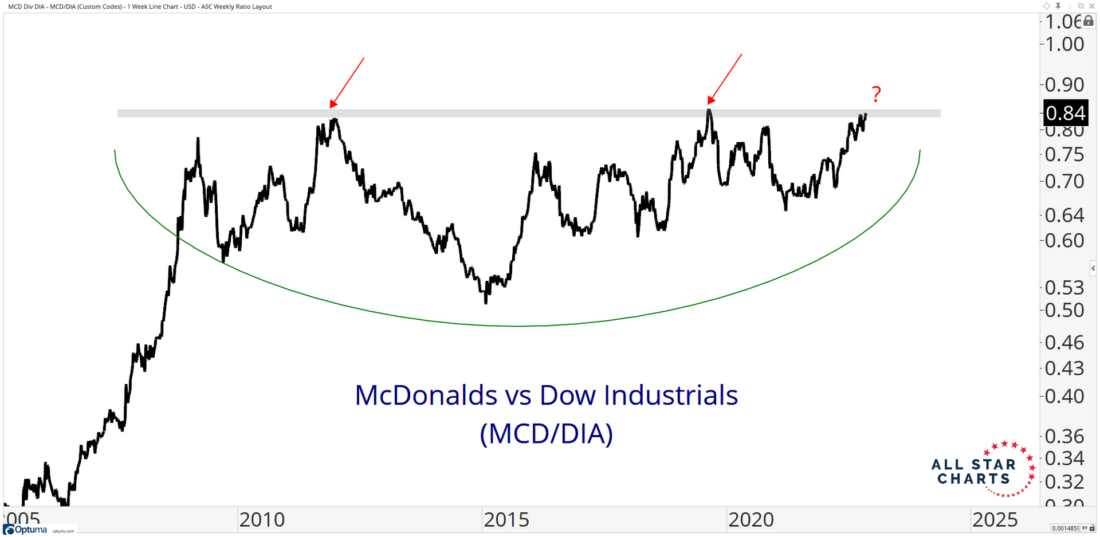
Studying ratio charts like the one above allows us to identify the strongest stocks within distinct sectors and indexes. It’s a vital component of technical analysis.
When we look at the relative trend for MCD, the ratio is testing the upper bounds of a massive base. After making little progress relative to its benchmark index for over a decade now, it could be time for MCD to assume a leadership role over the intermediate and long term. A breakout in this ratio would not only suggest further outperformance from MCD, but would also serve as compelling evidence for new highs on an absolute basis.
4/ Cryptocurrencies Test Summer Highs
While Bitcoin and Ether (ETH) have made little to no progress over the past few months, we’re seeing some strength beneath the surface in the crypto market.
The chart below graphs the FTX Altcoin Index, which includes some of the largest tokens other than Bitcoin, such as Cardano (ADA), Solana (SOL), Binance (BNB), and Dogecoin (DOGE), among others.

Unlike Bitcoin, which is still trading roughly 25% below its August highs, the FTX Altcoin Index is testing its August level this week. Altcoins are not only outperforming Bitcoin, but these highly-speculative assets have also been outperforming stocks since the lows of early summer. This relationship is shown in the lower pane.
Seeing a breakout above this key resistance zone could suggest an increase in risk appetite among investors. This is yet another sign that positive animal spirits, or bullish risk appetite, is returning to the market.
—
Originally posted 2nd November, 2022
Disclosure: Investopedia
Investopedia.com: The comments, opinions and analyses expressed herein are for informational purposes only and should not be considered individual investment advice or recommendations to invest in any security or to adopt any investment strategy. While we believe the information provided herein is reliable, we do not warrant its accuracy or completeness. The views and strategies described on our content may not be suitable for all investors. Because market and economic conditions are subject to rapid change, all comments, opinions and analyses contained within our content are rendered as of the date of the posting and may change without notice. The material is not intended as a complete analysis of every material fact regarding any country, region, market, industry, investment or strategy. This information is intended for US residents only.
Disclosure: Interactive Brokers
Information posted on IBKR Campus that is provided by third-parties does NOT constitute a recommendation that you should contract for the services of that third party. Third-party participants who contribute to IBKR Campus are independent of Interactive Brokers and Interactive Brokers does not make any representations or warranties concerning the services offered, their past or future performance, or the accuracy of the information provided by the third party. Past performance is no guarantee of future results.
This material is from Investopedia and is being posted with its permission. The views expressed in this material are solely those of the author and/or Investopedia and Interactive Brokers is not endorsing or recommending any investment or trading discussed in the material. This material is not and should not be construed as an offer to buy or sell any security. It should not be construed as research or investment advice or a recommendation to buy, sell or hold any security or commodity. This material does not and is not intended to take into account the particular financial conditions, investment objectives or requirements of individual customers. Before acting on this material, you should consider whether it is suitable for your particular circumstances and, as necessary, seek professional advice.
Disclosure: Bitcoin Futures
TRADING IN BITCOIN FUTURES IS ESPECIALLY RISKY AND IS ONLY FOR CLIENTS WITH A HIGH RISK TOLERANCE AND THE FINANCIAL ABILITY TO SUSTAIN LOSSES. More information about the risk of trading Bitcoin products can be found on the IBKR website. If you're new to bitcoin, or futures in general, see Introduction to Bitcoin Futures.
Disclosure: Futures Trading
Futures are not suitable for all investors. The amount you may lose may be greater than your initial investment. Before trading futures, please read the CFTC Risk Disclosure. A copy and additional information are available at ibkr.com.


