


AT A GLANCE
- Options volatility in corn, measured by the CVL index, recently reached levels more than double 2019 and 2020 levels.
- The new indexes help show how the corn market has traded this summer with call options implied volatility increasing significantly going into the June 30 Acreage report.
Over the past year, and even more so in the last few months we’ve seen a significant change in corn market fundamentals. From a year ago, the corn ending stocks to usage has gone from 13.75% to 7.4%, one of the lowest on record. Demand for U.S. grains has been at historic levels during 2021. U.S. weather during the last few key production months has featured hot and dry weather over significant parts of the growing region.
All of this has driven significant volatility. But how does that volatility stack up to recent years and what can volatility tell us about risk and risk management strategies? Many of those answers can be found in the new CVOL Index that CME started publishing in February 2021.
If we look at the CVL Index, which measures corn volatility, we can see it reached a high of 57 recently, more than double compared to 2019 and early 2020 levels. The chart below shows the CVL Index over the last two years. The dotted line is price and the solid line is the CVL Index.
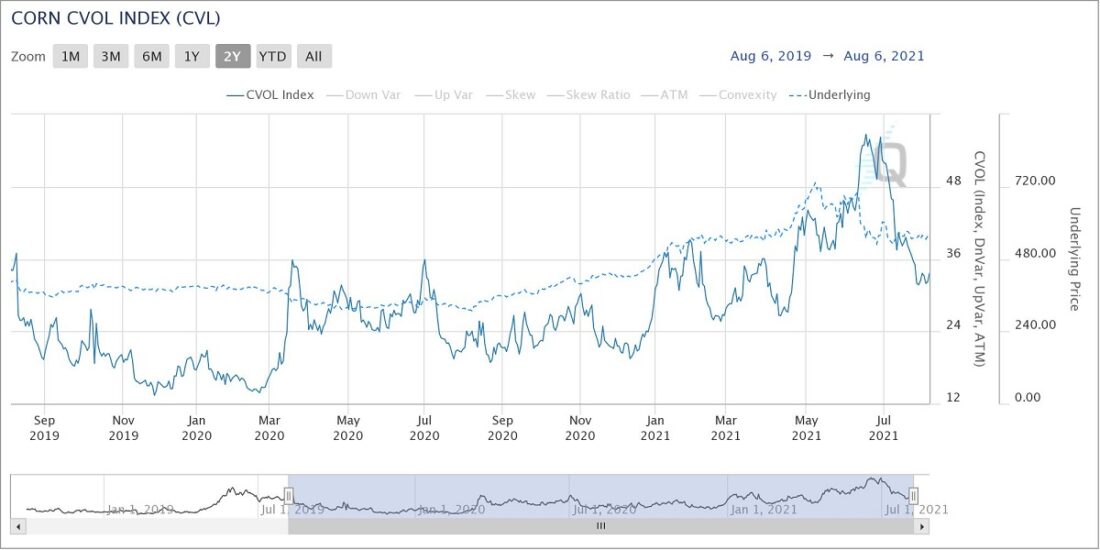
Corn CVL Index August 2019 – August 2021
As a grain participant, the CVL Index can help visualize how implied volatility is reacting to market conditions which directly impacts the price of corn options. The index covers an array of strikes and maturities, allowing for a baseline on what is happening in the options market. It is part of the larger suite of new CVOL indexes, which capture constant 30-day implied volatility and clarify it through a unique prism that generates new sets of robust volatility indices. Thirty-day implied volatility is a liquid and sensitive part of the volatility surface and is closely watched by market participants. Traditionally it has been difficult to easily see 30-day implied volatility as options decay or drift towards maturity.
Market Sentiment Shown Through Options
CME Group built CVOL to easily separate and recombine parts of the surface related to calls and puts to deliver Upward Variance from out of the money (OTM) calls, called Up Var, and Downward Variance from OTM puts called Down Var. These variance tools provide insight into possible asymmetry in the implied volatility curve by isolating just the call or put wing of the volatility surface.
Looking at UPVar in corn over time, you can see the wide range of values. This is showing how market participants have reacted to price and what seasonal factors are at play. The UP Var index uses an array of out of the money calls to create a holistic view of upside sentiment, you can see how call implied volatility peaked going into the June 30 Acreage report. Market participants can use this information as a general guide to understand how call options are changing in terms of the volatility surface and then use the data to optimize hedging and risk/reward profiles.
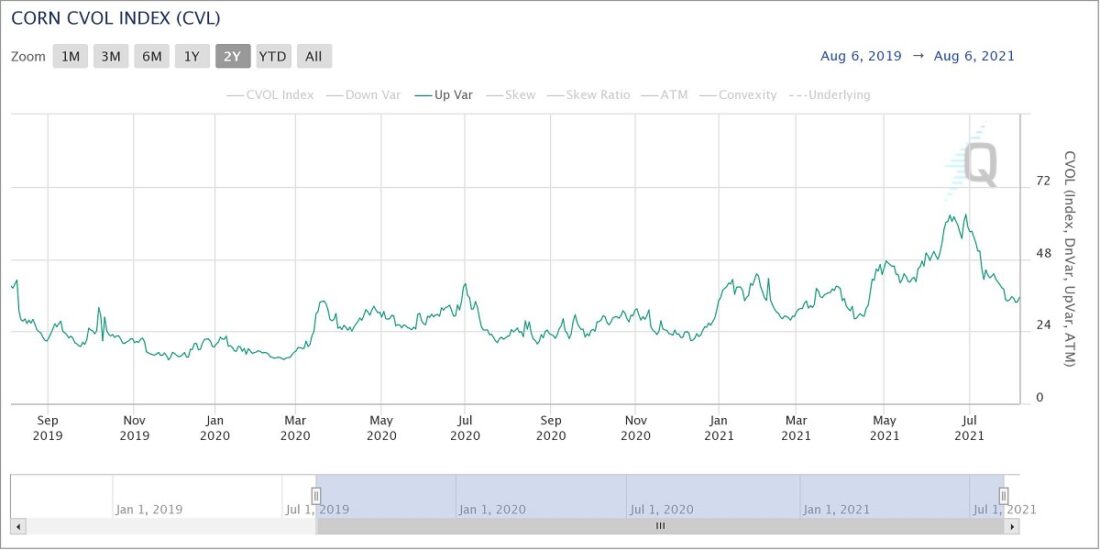
Call implied volatility peaked going into the June 30 Acreage report.
Positive Skew
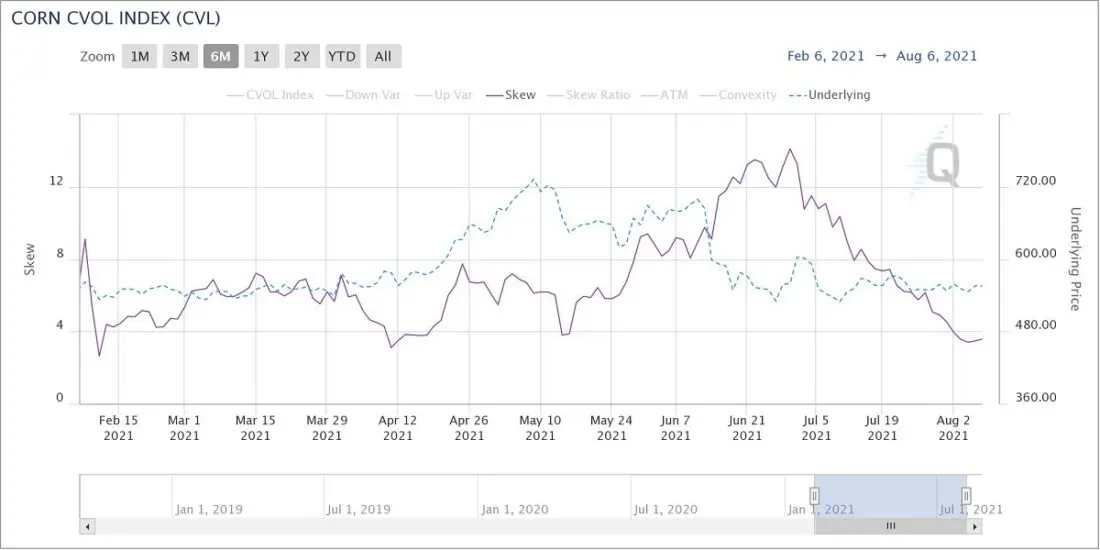
The Grain & Oilseed complex typically exhibits a positive skew, indicating that market participants expect price to exhibit higher velocity as the price of corn increases. The level of skew can change quite dramatically in Ag markets. The chart below shows corn skew increasing from 8% to almost 15% in the month of June when corn prices declined significantly. Skew helps show shifts in demand and expectations looking at the upside relative to the downside.
Traders are always seeking the most comprehensive data to help them prepare for the unexpected. In a market defined by high global demand and uncertain fundamentals, CVL is another tool they can look to navigate corn markets.
—
Originally Posted on August 16, 2021 – As Demand for Corn Grows, New Key Data Points to Watch
Disclosure: Interactive Brokers
Information posted on IBKR Campus that is provided by third-parties does NOT constitute a recommendation that you should contract for the services of that third party. Third-party participants who contribute to IBKR Campus are independent of Interactive Brokers and Interactive Brokers does not make any representations or warranties concerning the services offered, their past or future performance, or the accuracy of the information provided by the third party. Past performance is no guarantee of future results.
This material is from CME Group and is being posted with its permission. The views expressed in this material are solely those of the author and/or CME Group and Interactive Brokers is not endorsing or recommending any investment or trading discussed in the material. This material is not and should not be construed as an offer to buy or sell any security. It should not be construed as research or investment advice or a recommendation to buy, sell or hold any security or commodity. This material does not and is not intended to take into account the particular financial conditions, investment objectives or requirements of individual customers. Before acting on this material, you should consider whether it is suitable for your particular circumstances and, as necessary, seek professional advice.
Disclosure: Options Trading
Options involve risk and are not suitable for all investors. Multiple leg strategies, including spreads, will incur multiple commission charges. For more information read the "Characteristics and Risks of Standardized Options" also known as the options disclosure document (ODD) or visit ibkr.com/occ
Disclosure: Futures Trading
Futures are not suitable for all investors. The amount you may lose may be greater than your initial investment. Before trading futures, please read the CFTC Risk Disclosure. A copy and additional information are available at ibkr.com.


