


“When oil stocks lead the market, that’s usually not a good thing.” This is a pearl of wisdom that was imparted to me by a veteran trader shortly after I started on Wall Street. That advice always stuck with me, not least because it was imparted to me in the summer of 1987, shortly before the ensuing crash.
There is a logic to that statement. Higher energy prices are often a sign of higher inflation, and markets usually fear inflation. That said, there are a few key differences between now and then. For starters, the energy sector has a much smaller weight than it did at that time, and memories of the 1970’s energy crisis were still fresh among market participants. Perhaps most importantly, the Federal Reserve’s approach to inflation fighting has changed markedly. Inflation fears led to Fed tightening, which was unfriendly to equities. The 1980’s began with Chairman Volcker dramatically raising short-term rates to combat inflation, and the Fed was committed to keeping inflation contained. Thus, any sign of incipient inflationary pressure was a reason for concern. Now the Fed has a very different approach. They have signaled that they would rather let inflation run hot than risk missing their 2% target, not to mention their stated commitment not to tighten until or unless we reach their full employment mandate.
Unfortunately, I just backed into the most dangerous phrase in financial markets: “This time it’s different.” Investors are certainly more tied to the idea of not fighting the Fed than at any time I can remember – a strategy that has worked phenomenally well for over a decade – and the Fed has gone to great lengths to show that they are indeed approaching inflationary pressures with a different mindset than their predecessors. Still, I have a difficult time simply abandoning market history. Let’s try to figure out if the current situation provides any cause for concern.
We have all heard about rising oil prices, and anyone who drives is well aware that prices at the pump have soared. Looking at the chart below, investors might mistake a six-month chart of crude oil futures for that of a high-flying stock.
WTI Crude Oil Futures, 6-Months, Rolling Front Month
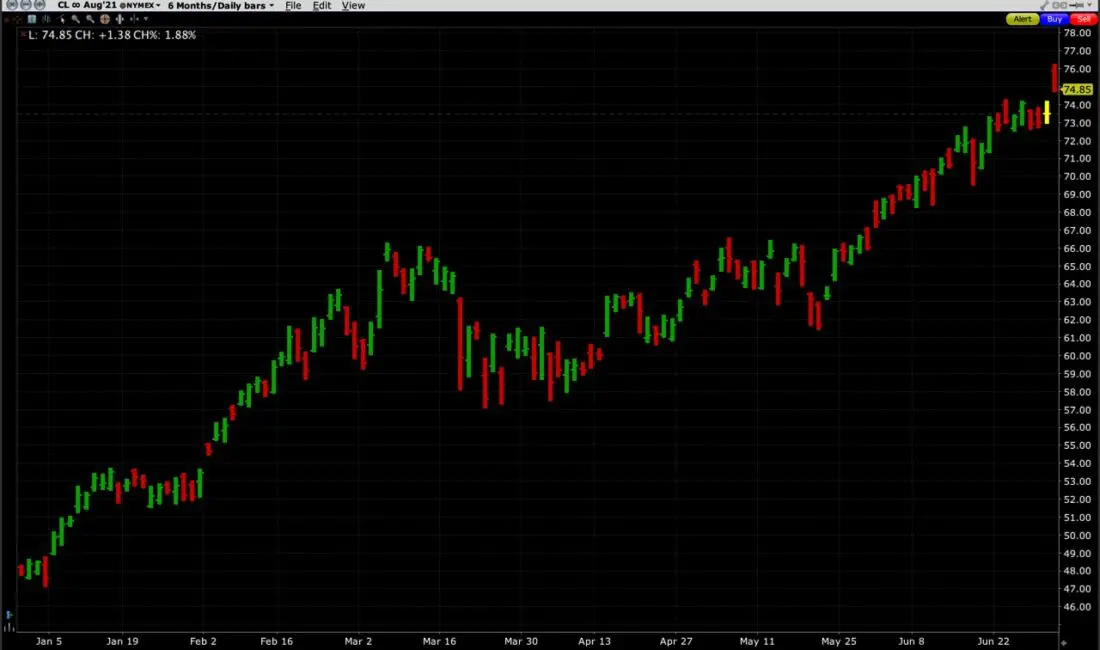
Source: Interactive Brokers
We see that crude has risen over 60% over the past few months, which is a stellar performance for any financial instrument, let alone a critical input that is used throughout the economy. It is also a very visible measure of inflation for average people. Not everyone is attuned to the price of soybeans or copper on a daily basis, but we drive past gas stations every day and most of us fill up our cars regularly. Even though most economists prefer to utilize inflation measures that ignore volatile food and energy prices, consumers tend to do the opposite. Food and energy are routine purchases, and those play an important role in individuals’ opinions about the pace of inflation. As yet, that difference of opinion has not been sufficient to influence the Fed’s opinion that inflation remains transitory, not permanent.
Not surprisingly, energy stocks have substantially outperformed the broader market, as evidenced below:
Energy Select Sector SPDR (XLE, bars) vs. S&P 500 Index (SPX, blue), 6-Months

Source: Interactive Brokers
Using the Energy Select Sector SPDR (XLE) as a proxy, we see that the sector’s 48% jump year-to-date is commensurate with oil’s move so far. This is in comparison to the not-at-all shabby 14% gain in SPX over the same period. It is quite evident that oil stocks are indeed leading the market. (Fun fact, on July 1st, today, a 6-month chart and a year-to-date chart are identical).
As with many charts, however, it can be all about perspective. The situation looks quite different on a two-year chart:
Energy Select Sector SPDR (bars) vs. S&P 500 Index (blue), 2 Years

Source: Interactive Brokers
In this view we see that energy stocks were underperforming before the Covid crisis disrupted markets, and that they have still not rebounded to the levels they traded two years ago. This is in stark contrast to an SPX that makes new highs on seemingly a daily basis. We also see that it took XLE until November to keep pace with the rise in SPX. Essentially, the phenomenal outperformance of XLE over the past 6 months has been more about it playing catch-up than being a leader.
Thus it is too early to say whether my colleague’s old warning is appropriate. Over the recent term, it is clear that energy stocks have been the market leader. Yet over the longer term, it isn’t even clear that we should be concerned about it. True, the price of oil has recently performed more like a meme stock than a stodgy, dirty commodity. It is not a pleasant situation for energy consumers – which almost all of us are – but it is not clear that it is a red flag for equity investors right now.
Disclosure: Interactive Brokers
The analysis in this material is provided for information only and is not and should not be construed as an offer to sell or the solicitation of an offer to buy any security. To the extent that this material discusses general market activity, industry or sector trends or other broad-based economic or political conditions, it should not be construed as research or investment advice. To the extent that it includes references to specific securities, commodities, currencies, or other instruments, those references do not constitute a recommendation by IBKR to buy, sell or hold such investments. This material does not and is not intended to take into account the particular financial conditions, investment objectives or requirements of individual customers. Before acting on this material, you should consider whether it is suitable for your particular circumstances and, as necessary, seek professional advice.
The views and opinions expressed herein are those of the author and do not necessarily reflect the views of Interactive Brokers, its affiliates, or its employees.
Disclosure: Futures Trading
Futures are not suitable for all investors. The amount you may lose may be greater than your initial investment. Before trading futures, please read the CFTC Risk Disclosure. A copy and additional information are available at ibkr.com.


