


By CME Group
Live Cattle and Feeder Cattle futures prices have been on the rise since mid-2020, with front-month Feeder Cattle futures reaching an all-time high of $249.525/cwt on August 4, 2023. Severe drought conditions in 2022 incentivized producers to place cattle in feedlots for finishing earlier than they may have otherwise, as dry conditions limited available forage and drove feeding costs higher. These early placements included an increasing proportion of heifers, or young female animals who have never given birth and who will not be retained for future breeding purposes. Additionally, federally inspected beef cow harvest numbers, or slaughter numbers of mature animals that have previously given birth, increased 11% in 2022 vs. 2021, which further reduced herd numbers. According to the USDA, the total headcount of 28.9 million beef cows in the United States was down 4% year-over-year on January 1, 2023, the lowest inventory for the start of the year since 1962.
High prices and low inventory
The cattle cycle tracks the total inventory of both cattle and calves in the United States, averaging eight-12 years from peak to trough with 12 peaks and 11 troughs documented since 1890. The cycle is indicative of producer and packer supply and demand, which are influenced by immediate and forecasted cattle prices, input costs, weather, breeding, and genetics.
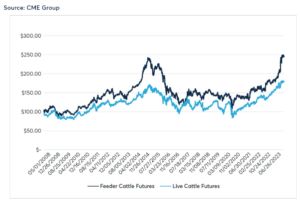
Front-month Live Cattle and Feeder Cattle futures daily settlement price, $/cwt
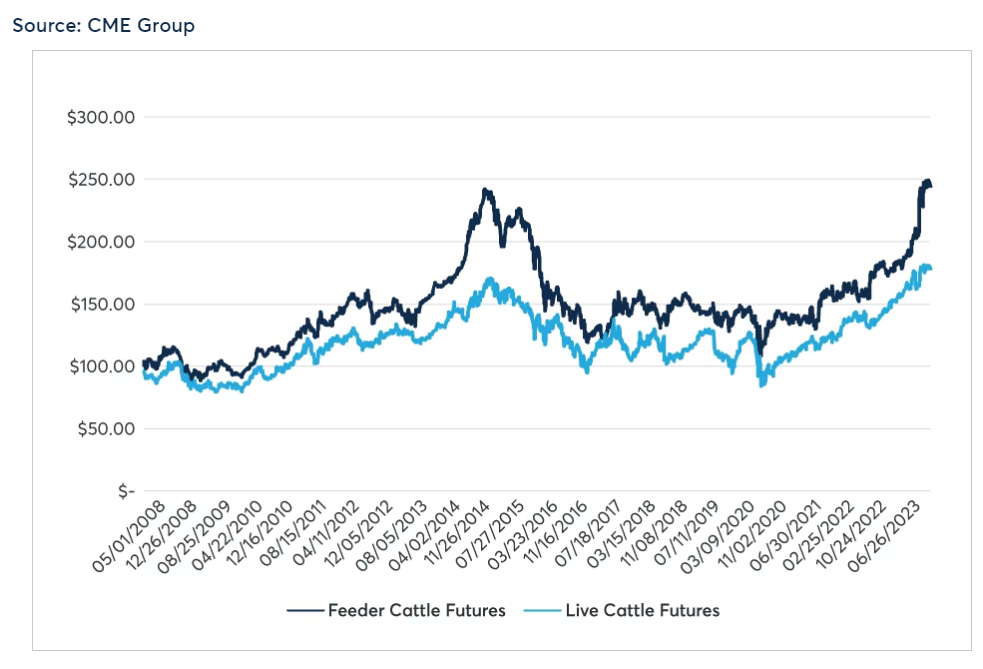
Live Cattle and Feeder Cattle futures prices have been on the rise since mid-2020, with front-month Feeder Cattle futures reaching an all-time high of $249.525/cwt on August 4, 2023. Severe drought conditions in 2022 incentivized producers to place cattle in feedlots for finishing earlier than they may have otherwise, as dry conditions limited available forage and drove feeding costs higher. These early placements included an increasing proportion of heifers, or young female animals who have never given birth and who will not be retained for future breeding purposes. Additionally, federally inspected beef cow harvest numbers, or slaughter numbers of mature animals that have previously given birth, increased 11% in 2022 vs. 2021, which further reduced herd numbers. According to the USDA, the total headcount of 28.9 million beef cows in the United States was down 4% year-over-year on January 1, 2023, the lowest inventory for the start of the year since 1962.
U.S. cattle inventory by cycle, 1979-present
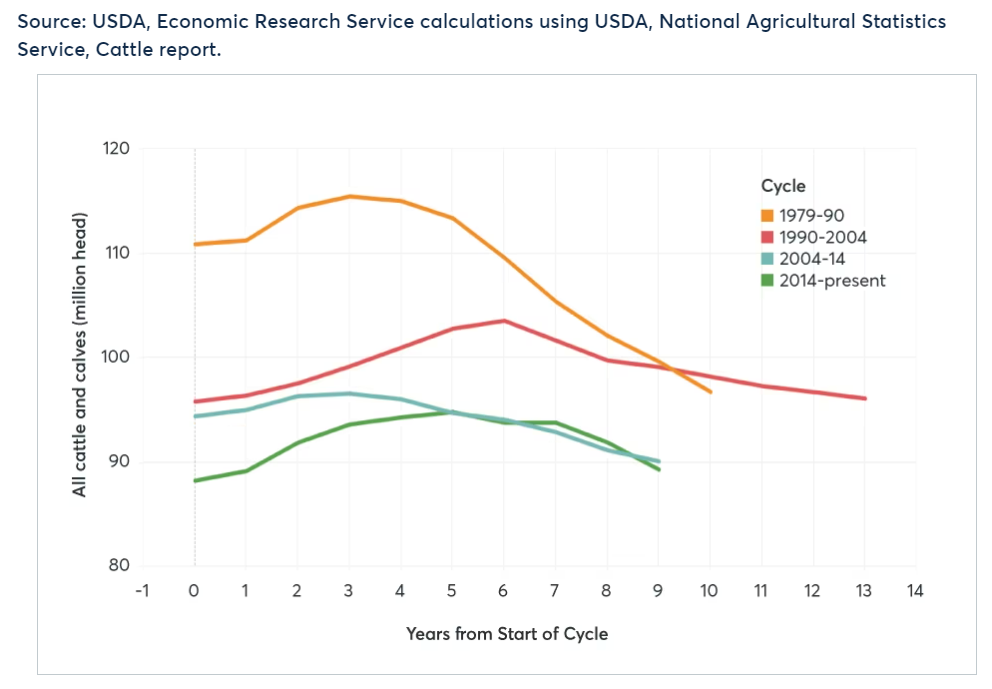
Meanwhile, federally inspected heifer slaughter accounted for 30.6% of total cattle slaughtered in 2022, the highest annual level since 2005. While this level is not yet declining, with the proportion of heifer slaughter through May at 31.3%, the trend will eventually reverse course as the need for producers to keep heifers for breeding purposes grows. The trade closely watches heifer retention to gain insight into the current cycle and when the next is expected to begin. When heifer retention levels start to increase significantly, one can surmise that the inflection point is near.
The lives of American beef cattle
Beef-cattle life in the United States generally begins on a cow-calf operation. Cow-calf operations in the United States average 44 head nationally, with 90% of the operations family-owned. Grazing land covers 27% of the United States by area, or 614 million acres as of 2022.
Cow-calf operations, particularly in the Western United States, are frequently situated on land not suitable for crop production. Cattle gestation takes approximately 280 days and cows can give birth once per year. Breeding cows and their calves, on the whole, are maintained year round in pastures with little to no grain input. Once calves are weaned, unless the animals are chosen to stay in the operation to breed, they will enter the feeding system through various paths such as a stocker or backgrounding operation and will eventually be sold as “feeder cattle.”
The CME Group Feeder Cattle futures contract represents this stage in the cattle lifecycle. One Feeder Cattle futures contract represents 50,000 pounds of steers between 700 and 899 pounds sold at auction in the 12-state region of Colorado, Iowa, Kansas, Missouri, Montana, Nebraska, New Mexico, North Dakota, Oklahoma, South Dakota, Texas, and Wyoming. Cattle must be of Medium and Large Frame #1 and Medium and Large Frame #1-2. Cattle identified as predominantly dairy, exotic, or Brahma breeding are excluded. A daily index is calculated from USDA-reported auctions of such animals, on which the futures contract is financially settled at expiration.
Once at the feedlot, animals are fed with a target weight gain of 2.5-4lbs per day. Rate of gain will differ by operation and animal due to various factors, but generally 6lbs of dry matter can translate to 1lb of gain. Feedlots provide a diet that can include corn, soybean meal, hay, grass, and wheat, as well as additives to optimize growth. Cattle will typically remain at the feedlot for three to six months. Once they have reached slaughter weight, the cattle are then sold to meat packers. Cattle price risk at this point in the supply chain can be managed using CME Group Live Cattle futures. One Live Cattle futures contract represents 40,000 pounds of live steers or heifers, each between 1,050 and 1,600 pounds depending on sex. Live Cattle futures is a physically delivered contract; delivery units shall have an estimated average hot yield of 63%. Par delivery for Live Cattle futures is 70% Choice, 30% Select, Yield Grade 3. The contract provides the option for carcass delivery at a slaughter plant or live-graded delivery at an approved stockyard.
Industry innovation
Cattle inventories, 1970-2022
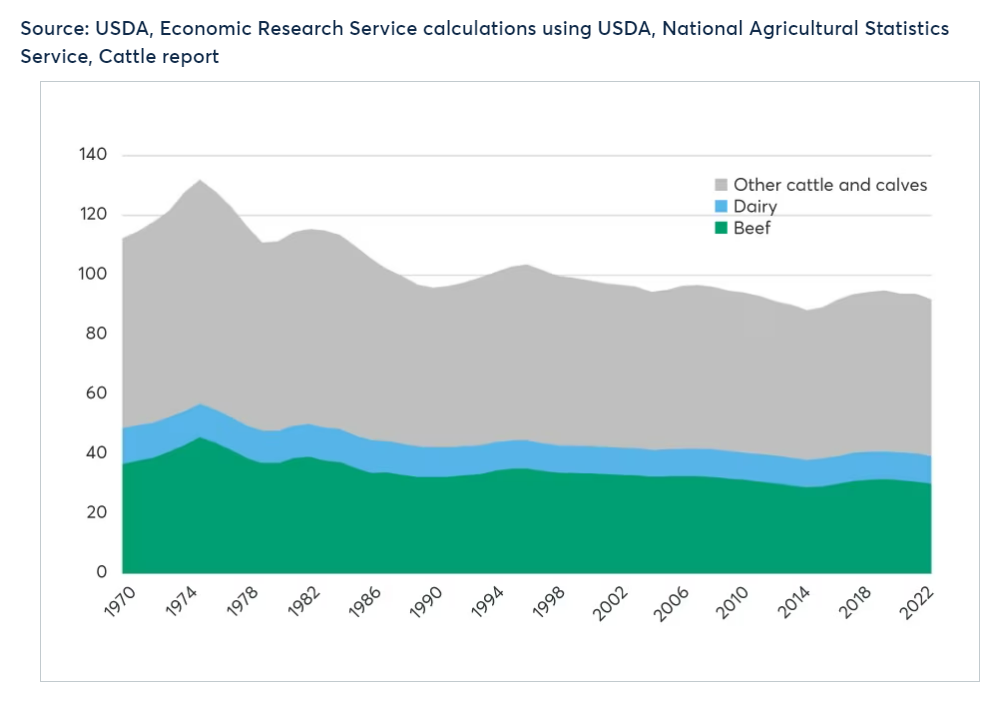
While the cattle cycle has existed for more than 130 years, the lifecycles of modern cattle differ greatly from those described by early cycles. The average age at slaughter for beef cattle in 1977, for example, was 609 days: 30% longer than the 468-day life of average beef cattle in 2007. Even at the significantly shorter life, the average carcass in 2007 yielded 28% more beef per animal (351kg in 2007 compared to 274kg in 1977). The same quantity of beef was produced in 2007 as in 1977 with only 69.9% of animals, and 81.4% of feedstuffs.
Conclusion
Low herd numbers, in part due to drought in cattle-producing regions, have sustained high prices of late, signaling the throes of the contraction phase of the cattle cycle. In response, heifer retention and eventual herd rebuilding are expected in the coming years. The duration of the remainder of the contraction phase will depend greatly on drought and pasture conditions as well as producer profitability. Throughout the present cattle cycle and beyond, CME Group will continue to provide global benchmarks for the evolving cattle industry to reference and manage price risk. Learn more at www.cmegroup.com/livestock.
—
Originally Posted August 30, 2023 – The Cattle Cycle Continues
All examples in this report are hypothetical interpretations of situations and are used for explanation purposes only. The views in this report reflect solely those of the author and not necessarily those of CME Group or its affiliated institutions. This report and the information herein should not be considered investment advice or the results of actual market experience.
Disclosure: Interactive Brokers
Information posted on IBKR Campus that is provided by third-parties does NOT constitute a recommendation that you should contract for the services of that third party. Third-party participants who contribute to IBKR Campus are independent of Interactive Brokers and Interactive Brokers does not make any representations or warranties concerning the services offered, their past or future performance, or the accuracy of the information provided by the third party. Past performance is no guarantee of future results.
This material is from CME Group and is being posted with its permission. The views expressed in this material are solely those of the author and/or CME Group and Interactive Brokers is not endorsing or recommending any investment or trading discussed in the material. This material is not and should not be construed as an offer to buy or sell any security. It should not be construed as research or investment advice or a recommendation to buy, sell or hold any security or commodity. This material does not and is not intended to take into account the particular financial conditions, investment objectives or requirements of individual customers. Before acting on this material, you should consider whether it is suitable for your particular circumstances and, as necessary, seek professional advice.
Disclosure: Futures Trading
Futures are not suitable for all investors. The amount you may lose may be greater than your initial investment. Before trading futures, please read the CFTC Risk Disclosure. A copy and additional information are available at ibkr.com.


Join The Conversation
If you have a general question, it may already be covered in our FAQs. If you have an account-specific question or concern, please reach out to Client Services.