


By: CME Group
Corn and soybeans compete for acreage in much of the United States, with each year’s predominant crop dependent on profitability. Though individual farmers may be constrained by the rotational needs of their fields, commodity price and input costs together determine general cost-effectiveness of corn and soybeans. As corn and soybeans vie for land, farmers favor one crop over the other and the price ratio between the two vacillates due to resultant supply. Pricing dynamics tend to revert to an historic average.
In the United States, corn and soybeans are grown in the same regions and by the same farmers, presenting producers in much of the country with the decision of how much to plant of each in the crop year. Crop rotation is necessary to maintain soil quality and yield, but perfect annual rotation is not strictly necessary. Farmers thus have a choice, year on year, of how much of which crop to plant, and profitability of each crop is what sways farmers towards one or the other. That is, lower yield due to crop repetition (within limits) may produce higher profits when one crop is priced more favorably.
The economic adage “the cure for high prices is high prices” in large part governs the soybean-corn relationship. For example, when soybeans are priced high relative to corn, farmers will plant more soybeans in lieu of corn, driving the price of beans down with now-increased supply. The migration from corn to beans will then reduce corn supply, therefore driving the price of corn up and restoring an historic price ratio between the two crops.
Table 1: September 2022 WASDE
| Commodity | Market Year | Area Planted (M ACRE) | Avg. Farm Price ($/BU) | Yield (BU/ACRE) |
| Corn | 2021/222022/23 | 93.4088.60 | 5.956.75 | 177.00172.50 |
| Soybeans | 2021/222022/23 | 87.2087.50 | 13.3014.35 | 51.4050.50 |
The September 2022 World Agricultural Supply Demand Estimates (WASDE) estimated that for the 2022-2023 crop year, domestic planted corn acreage decreased by 5.14% compared to the prior crop year, while planted soybean acreage increased slightly over that time period. Soybeans did not quite overtake corn as predicted by the March 2022 USDA Prospective Plantings report. The average national farm price is expected to increase by 13.45% for corn and 7.89% for soybeans year-over-year, while yield per harvested acre for will fall 2.54% and 1.75%, respectively, for domestic planted corn and soybeans.
The story of 2022 in farming, like in many sectors, is inflationary: high costs, high demand, and low supply. Although fertilizer is not a target of U.S. sanctions against Russia, the war in Ukraine has complicated trade with the Russian Federation, which is the world’s top exporter of nitrogen fertilizer, the second leading exporter of potash fertilizers, and the third largest supplier of phosphorus fertilizers. Record high fertilizer prices are part of the drive from corn to soybeans, as corn requires significantly more fertilizer per acre than do soybeans. At the same time, the war in Ukraine increases demand for U.S. corn in an atmosphere where the corn coming out of the Black Sea region is feared to be hampered and low wheat stocks beg substitution. On the soybean side, demand for renewable diesel, a biofuel functionally interchangeable with petrodiesel and commonly made from soybean oil, buoys the price of soybeans and encourages planting. Renewable diesel bulls even point to soybean oil availability as the primary barrier to scalability of the fuel.
Figure 1: Leading Corn and Soybeans Futures Daily Settlements, 2012-2022
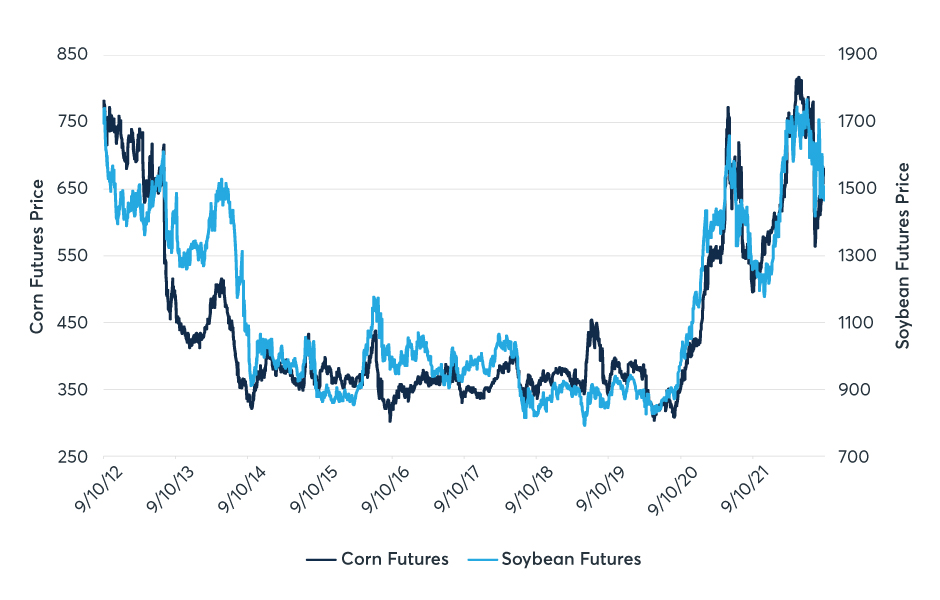
Figure 1 shows the front-month Soybean futures daily settlement price compared to the front-month Corn futures settlement price for the last decade. Corn futures and Soybean futures prices saw a steep upward trajectory in the pandemic recovery of 2021, and after a rebound later in that year, climbed again after the Russian invasion of Ukraine on February 24, 2022.
Figure 2: Correlation between Leading Corn and Soybeans Futures, 2012-2022
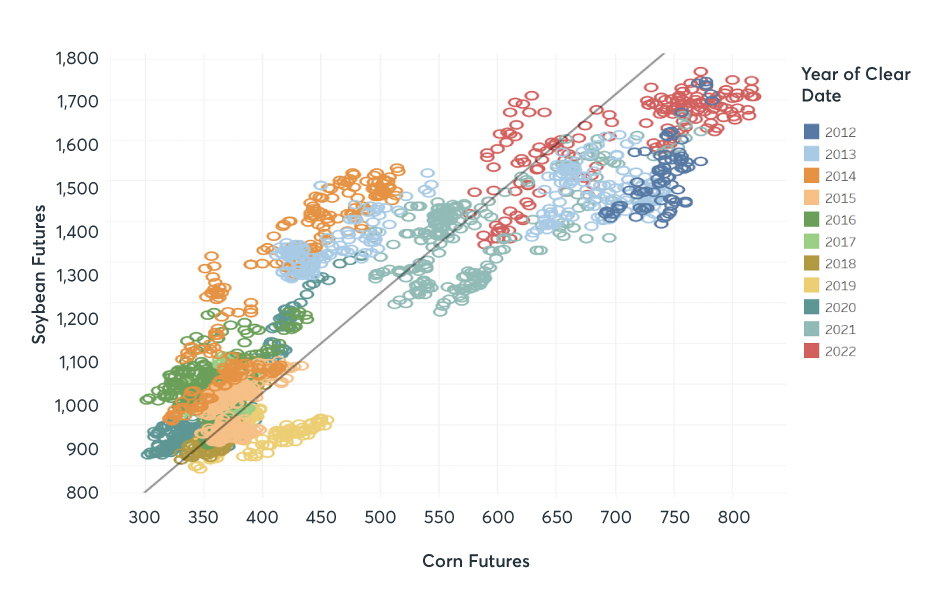
Figure 2 shows the correlation between daily settlement prices of front-month Corn futures and Soybean futures between 2012 and 2022. This year’s prices fall predominantly below the trendline, signaling that the soybean-corn ratio in 2022 has been low compared to the historical average. Figure 3 shows the soybean-corn ratio, calculated by front-month Soybean futures divided by front-month Corn futures daily settlement prices, averaged by week between 2012 and 2022. The average weekly spread (2012-2022) hovers just above 2.5 for the first half of the calendar year, then sees a slight increase in the summer months, and returns to 2.5 later in the year. This dynamic reflects the seasonality of the respective crops, which are both harvested late in the year and see seasonal highs in the summer. Front-month soybean seasonal highs tend to be more pronounced than those of corn.
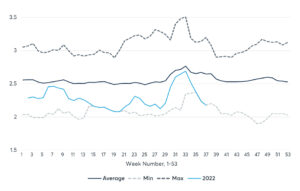
Figure 3: Soybean-Corn Ratio by Week
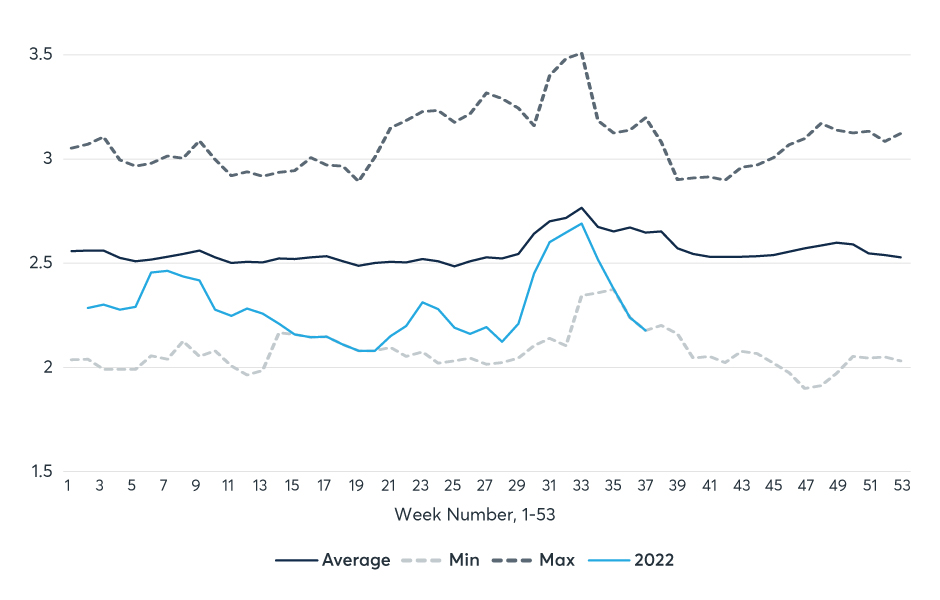
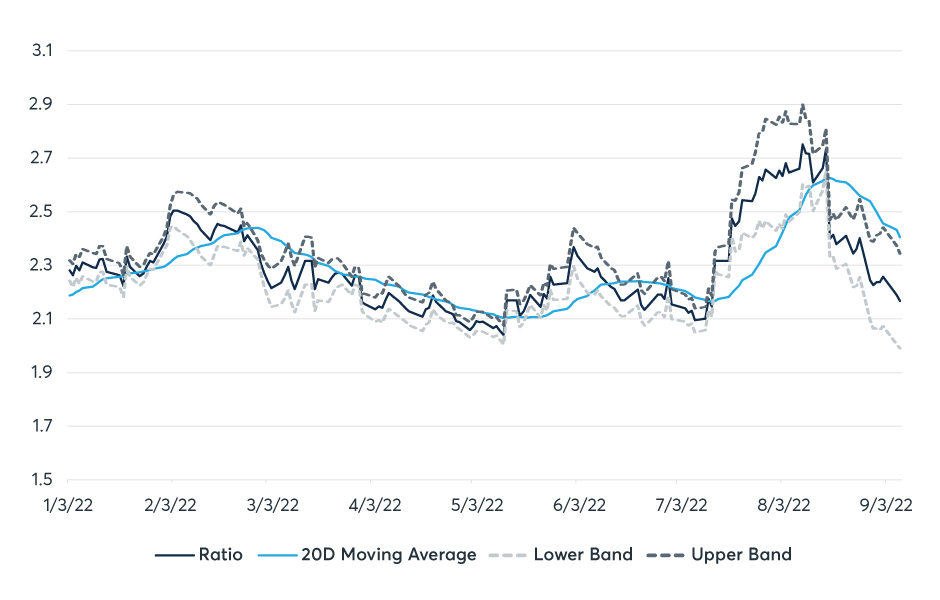
The bean-corn ratio in the current year has averaged less than 2.5, with recent weeks marking the lowest ratio seen in the past decade, after high soybean prices sent the ratio rising in August. Figure 4 gives a detailed view of 2022’s pricing dynamics.
Figure 4: Soybean-Corn Ratio YTD 2022
Classical microeconomics presents students with the question of how many widgets to produce and at what price. Working economists criticize this question as secondary to the needs of real-life producers, whose primary quandary is whether to make widgets at all, or rather something else entirely. Every spring, U.S. farmers face the question of what to plant, not just how much to plant. With corn and soybeans continually vying for dominance and the soil-nutrient needs of farmers demanding rotation, the question is not a light one and necessarily incurs risk. CME Group offers a range of Corn futures and option and Soybean futures and option products with which to manage that risk. Learn more at www.cmegroup.com/agriculture.
—
Originally Posted October 4, 2022 – The Soybean-Corn Ratio in 2022
All examples in this report are hypothetical interpretations of situations and are used for explanation purposes only. The views in this report reflect solely those of the author and not necessarily those of CME Group or its affiliated institutions. This report and the information herein should not be considered investment advice or the results of actual market experience.
Disclosure: Interactive Brokers
Information posted on IBKR Campus that is provided by third-parties does NOT constitute a recommendation that you should contract for the services of that third party. Third-party participants who contribute to IBKR Campus are independent of Interactive Brokers and Interactive Brokers does not make any representations or warranties concerning the services offered, their past or future performance, or the accuracy of the information provided by the third party. Past performance is no guarantee of future results.
This material is from CME Group and is being posted with its permission. The views expressed in this material are solely those of the author and/or CME Group and Interactive Brokers is not endorsing or recommending any investment or trading discussed in the material. This material is not and should not be construed as an offer to buy or sell any security. It should not be construed as research or investment advice or a recommendation to buy, sell or hold any security or commodity. This material does not and is not intended to take into account the particular financial conditions, investment objectives or requirements of individual customers. Before acting on this material, you should consider whether it is suitable for your particular circumstances and, as necessary, seek professional advice.
Disclosure: Futures Trading
Futures are not suitable for all investors. The amount you may lose may be greater than your initial investment. Before trading futures, please read the CFTC Risk Disclosure. A copy and additional information are available at ibkr.com.


