


- With equities posting their best returns since November 2020, equity ETFs took in $60 billion and outpaced bond ETFs by $43 billion last month — raising the three-month difference figure to almost $100 billion.
- With another $6 billion, and led by cyclicals, sector ETFs cemented a new record of 13 months in a row with inflows.
- Bond ETFs took in a respectable $17 billion, but were driven by a record-setting $6 billion of inflows into TIPS and almost $3 billion of flows into below-investment-grade credit.
Led by US equities, global stocks posted their best return (+5.0%) since November 2020. The S&P 500 rebounded out of the gate, registering multiple new all-time highs during the month to send the full-year figure to 59 new highs — the third-highest amount in any calendar year in the past 20 years (behind 2017 and 1995).1
These gains have come at the expense of sagging bond returns. Global core bonds are poised to register one of their worst returns (-4.3%) in nearly 20 years — diversification on display, perhaps. Yet, given the strength in stocks, the 60/40 portfolio has still returned 8%, a level that is more than the prior 30-year historical average (+6.7%)2 — not bad for a strategy that is supposed to be dead.
But the year is not over yet. With two months left, we are in the final countdown to how this period could/will be remembered. Right now, investors continue to remain optimistic, evidenced by significant allocations to risk assets for the first 10 months of the year.
Stocks for the Long Run
ETFs continue to break records, taking in $82 billion in October. This is their 12th month in a row with more than $40 billion of inflows — a streak that began in November of 2020 when clarity on the vaccine timeline kickstarted this current phase of the rally and risk-on buying behavior.
These strong flows were once again led by equities. Equity ETFs took in $60 billion last month, their fifth-most ever, propelling full-year totals to a record $539 billion — a figure where, if no other asset class had inflows on the year, would be a record for ETFs in and of itself.
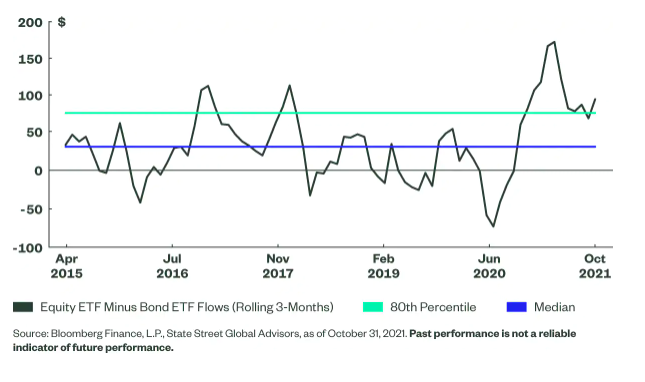
Not only does the absolute size of the flows into equity ETFs paint a bullish risk-on positioning picture, but the relative flows do as well. In October, equity funds took in $40 billion more than fixed income ETFs — their 12th month in a row of doing so. These flows have now pushed the trailing three-month stock-to-bond flow difference figure to nearly $100 billion and above the 80th percentile, as shown below.
Percent of Funds with Inflows Per Month
Click here to read the full article
Footnotes
1FactSet, as of October 31, 2021.
2Bloomberg Finance L.P., as of October 31, 2021, based on annually rebalanced exposure of 60% MSCI ACWI Index and 40% Bloomberg Global Aggregate Index.
Glossary
Bloomberg Global Aggregate Bond Index
A broad-based flagship benchmark that measures the investment grade, global fixed-rate taxable bond market.
MSCI ACWI Index
A market-capitalization-weighted stock market index that measures the stock performance of the companies in developed and emerging markets.
S&P 500® Index
A market-capitalization-weighted stock market index that measures the stock performance of the 500 largest publicly traded companies in the United States.
—
Originally Posted on November 3, 2021 – October Flash Flows: Risk-on Into the Final Countdown
Disclosure
The views expressed in this material are the views of the SPDR Research and Strategy team and are subject to change based on market and other conditions. It should not be considered a solicitation to buy or an offer to sell any security. It does not take into account any investor’s particular investment objectives, strategies, tax status or investment horizon. There is no representation or warranty as to the current accuracy of such information, nor liability for decisions based on such information. Past performance is no guarantee of future results.
Unless otherwise noted, all data and statistical information were obtained from Bloomberg LP and SSGA as of October 31, 2021. Data in tables have been rounded to whole numbers, except for percentages, which have been rounded to the nearest tenth of a percent.
The research and analysis included in this document have been produced by SSGA for its own investment management activities and are made available here incidentally. Information obtained from external sources is believed to be reliable and is as of the date of publication but is subject to change. This information must not be used in any jurisdiction where prohibited by law and must not be used in a way that would be contrary to local law or legislation. No investment advice, tax advice, or legal advice is provided herein.
Investing involves risk including the risk of loss of principal.
Bonds generally present less short-term risk and volatility than stocks, but contain interest rate risk (as interest rates raise, bond prices usually fall); issuer default risk; issuer credit risk; liquidity risk; and inflation risk. These effects are usually pronounced for longer-term securities. Any fixed income security sold or redeemed prior to maturity may be subject to a substantial gain or loss.
Equity securities may fluctuate in value in response to the activities of individual companies and general market and economic conditions.
Concentrated investments in a particular sector or industry tend to be more volatile than the overall market and increases risk that events negatively affecting such sectors or industries could reduce returns, potentially causing the value of the Fund’s shares to decrease.
The whole or any part of this work may not be reproduced, copied or transmitted or any of its contents disclosed to third parties without SSGA’s express written consent.
Disclosure: State Street Global Advisors
Do not reproduce or reprint without the written permission of SSGA.
All information has been obtained from sources believed to be reliable, but its accuracy is not guaranteed. There is no representation or warranty as to the current accuracy, reliability or completeness of, nor liability for, decisions based on such information and it should not be relied on as such.
State Street Global Advisors and its affiliates (“SSGA”) have not taken into consideration the circumstances of any particular investor in producing this material and are not making an investment recommendation or acting in fiduciary capacity in connection with the provision of the information contained herein.
ETFs trade like stocks, are subject to investment risk, fluctuate in market value and may trade at prices above or below the ETF’s net asset value. Brokerage commissions and ETF expenses will reduce returns.
Bonds generally present less short-term risk and volatility than stocks, but contain interest rate risk (as interest rates raise, bond prices usually fall); issuer default risk; issuer credit risk; liquidity risk; and inflation risk. These effects are usually pronounced for longer-term securities. Any fixed income security sold or redeemed prior to maturity may be subject to a substantial gain or loss.
Investing involves risk including the risk of loss of principal.
The whole or any part of this work may not be reproduced, copied or transmitted or any of its contents disclosed to third parties without SSGA’s express written consent.
Investing in high yield fixed income securities, otherwise known as “junk bonds”, is considered speculative and involves greater risk of loss of principal and interest than investing in investment grade fixed income securities. These Lower-quality debt securities involve greater risk of default or price changes due to potential changes in the credit quality of the issuer.
COPYRIGHT AND OTHER RIGHTS
Other third party content is the intellectual property of the respective third party and all rights are reserved to them. All rights reserved. No organization or individual is permitted to reproduce, distribute or otherwise use the statistics and information in this report without the written agreement of the copyright owners.
Definition:
Arbitrage: the simultaneous buying and selling of securities, currency, or commodities in different markets or in derivative forms in order to take advantage of differing prices for the same asset.
Fund Objectives:
SPY: The investment seeks to provide investment results that, before expenses, correspond generally to the price and yield performance of the S&P 500® Index. The Trust seeks to achieve its investment objective by holding a portfolio of the common stocks that are included in the index (the “Portfolio”), with the weight of each stock in the Portfolio substantially corresponding to the weight of such stock in the index.
VOO: The investment seeks to track the performance of a benchmark index that measures the investment return of large-capitalization stocks. The fund employs an indexing investment approach designed to track the performance of the Standard & Poor’s 500 Index, a widely recognized benchmark of U.S. stock market performance that is dominated by the stocks of large U.S. companies. The advisor attempts to replicate the target index by investing all, or substantially all, of its assets in the stocks that make up the index, holding each stock in approximately the same proportion as its weighting in the index.
IVV: The investment seeks to track the investment results of the S&P 500 (the “underlying index”), which measures the performance of the large-capitalization sector of the U.S. equity market. The fund generally invests at least 90% of its assets in securities of the underlying index and in depositary receipts representing securities of the underlying index. It may invest the remainder of its assets in certain futures, options and swap contracts, cash and cash equivalents, as well as in securities not included in the underlying index, but which the advisor believes will help the fund track the underlying index.
The funds presented herein have different investment objectives, costs and expenses. Each fund is managed by a different investment firm, and the performance of each fund will necessarily depend on the ability of their respective managers to select portfolio investments. These differences, among others, may result in significant disparity in the funds’ portfolio assets and performance. For further information on the funds, please review their respective prospectuses.
Entity Disclosures:
The trademarks and service marks referenced herein are the property of their respective owners. Third party data providers make no warranties or representations of any kind relating to the accuracy, completeness or timeliness of the data and have no liability for damages of any kind relating to the use of such data.
SSGA Funds Management, Inc. serves as the investment advisor to the SPDR ETFs that are registered with the United States Securities and Exchange Commission under the Investment Company Act of 1940. SSGA Funds Management, Inc. is an affiliate of State Street Global Advisors Limited.
Intellectual Property Disclosures:
Standard & Poor’s®, S&P® and SPDR® are registered trademarks of Standard & Poor’s® Financial Services LLC (S&P); Dow Jones is a registered trademark of Dow Jones Trademark Holdings LLC (Dow Jones); and these trademarks have been licensed for use by S&P Dow Jones Indices LLC (SPDJI) and sublicensed for certain purposes by State Street Corporation. State Street Corporation’s financial products are not sponsored, endorsed, sold or promoted by SPDJI, Dow Jones, S&P, their respective affiliates and third party licensors and none of such parties make any representation regarding the advisability of investing in such product(s) nor do they have any liability in relation thereto, including for any errors, omissions, or interruptions of any index.
BLOOMBERG®, a trademark and service mark of Bloomberg Finance, L.P. and its affiliates, and BARCLAYS®, a trademark and service mark of Barclays Bank Plc., have each been licensed for use in connection with the listing and trading of the SPDR Bloomberg Barclays ETFs.
Distributor: State Street Global Advisors Funds Distributors, LLC, member FINRA, SIPC, an indirect wholly owned subsidiary of State Street Corporation. References to State Street may include State Street Corporation and its affiliates. Certain State Street affiliates provide services and receive fees from the SPDR ETFs.
ALPS Distributors, Inc., member FINRA, is distributor for SPDR® S&P 500®, SPDR® S&P MidCap 400® and SPDR® Dow Jones Industrial Average, all unit investment trusts. ALPS Distributors, Inc. is not affiliated with State Street Global Advisors Funds Distributors, LLC.
Before investing, consider the funds’ investment objectives, risks, charges, and expenses. For SPDR funds, you may obtain a prospectus or summary prospectus containing this and other information by calling 1‐866‐787‐2257 or visiting www.spdrs.com. Please read the prospectus carefully before investing.
Disclosure: Interactive Brokers
Information posted on IBKR Campus that is provided by third-parties does NOT constitute a recommendation that you should contract for the services of that third party. Third-party participants who contribute to IBKR Campus are independent of Interactive Brokers and Interactive Brokers does not make any representations or warranties concerning the services offered, their past or future performance, or the accuracy of the information provided by the third party. Past performance is no guarantee of future results.
This material is from State Street Global Advisors and is being posted with its permission. The views expressed in this material are solely those of the author and/or State Street Global Advisors and Interactive Brokers is not endorsing or recommending any investment or trading discussed in the material. This material is not and should not be construed as an offer to buy or sell any security. It should not be construed as research or investment advice or a recommendation to buy, sell or hold any security or commodity. This material does not and is not intended to take into account the particular financial conditions, investment objectives or requirements of individual customers. Before acting on this material, you should consider whether it is suitable for your particular circumstances and, as necessary, seek professional advice.


