


Several factors have caused Chinese government bond yields to remain well above G7 yields; diverse developments in monetary, economic and financial regimes between China and the G7, and China’s low exposure to the global financial cycle have perhaps been key.
Although yield differentials fell a little when G7 yields rose sharply pre-COVID-19, the gap between Chinese and the US government bond yields has remained substantial as shown in Chart 1.
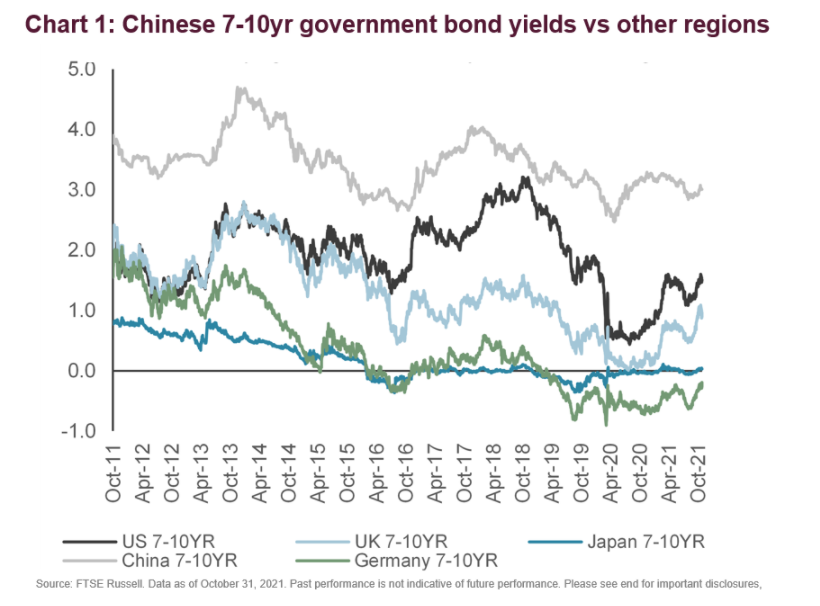
Moreover, apart from a COVID spike in 2020, the Chinese yield curve has been stable since 2018
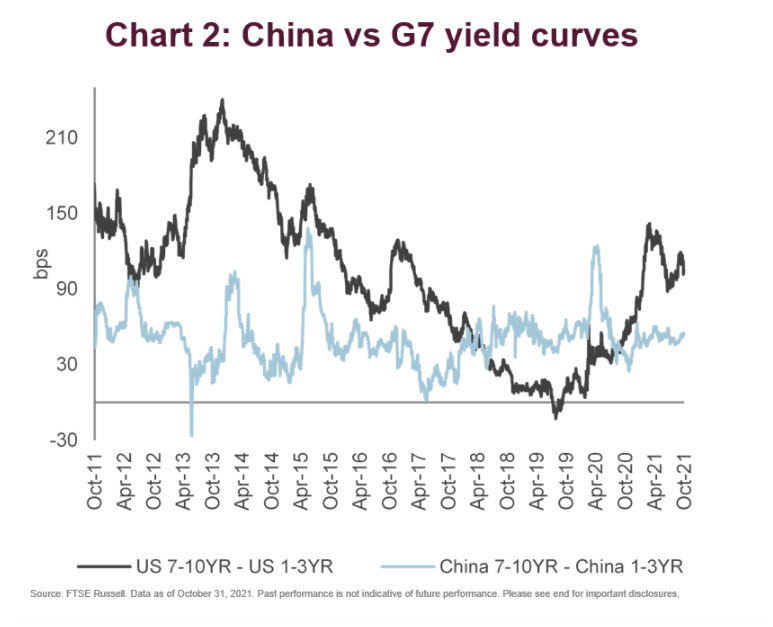
As well as low correlation with G7 yields in recent years, the Chinese 10s/2s yield curve has been more stable than most G7 yield curves in recent years, despite the PBOC not pursuing QE or formal yield curve control (unlike the Bank of Japan). Since 2018, apart from a brief COVID spike, the 10s/2s curve has moved within a narrow range of about 60 basis points. Even after the spike during the COVID pandemic in Q1 2020, Chinese yields and the yield curve rapidly mean-reverted, as Chart 2 shows. This is very different from the US Treasury curve, which has experienced far larger swings over the last three years.
Reasons for Chinese vs US bond yield differences
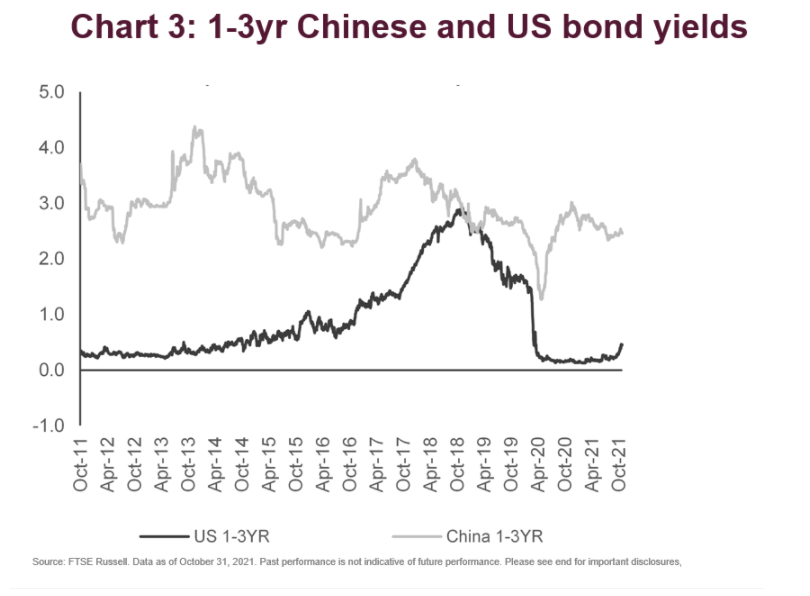
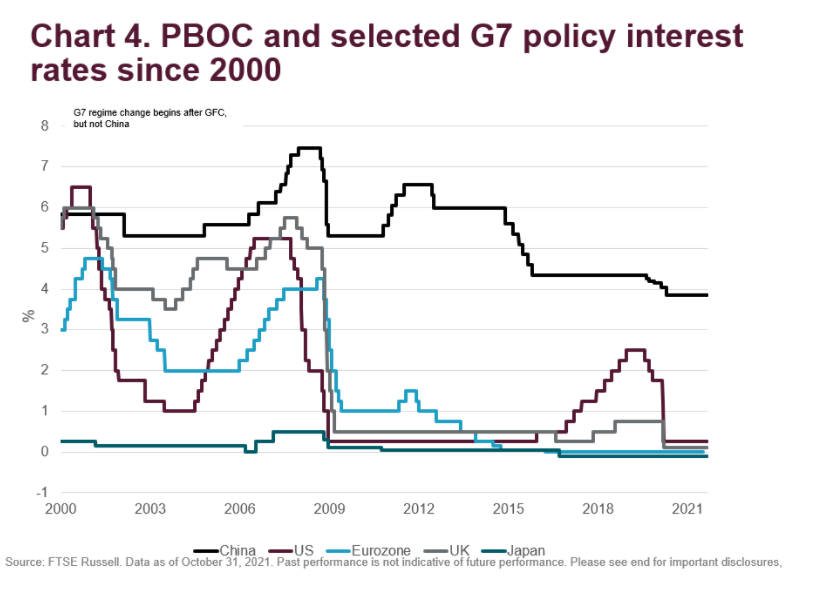
Instability in the US yield curve is due partly to pronounced swings in Fed policy rates and 2-year US yields, but also much higher volatility in 7-10yr yields than China. After tightening from 0-0.25% in Fed funds to a high of 2.5%-2.75% in Q4 2018, the Fed reversed its policy stance and reduced interest rates back to 0.25% in 2020, causing 1-3yr yields to decline almost 300bp in the process (see Charts 3 & 4).
But Chinese short-dated yields have also been volatile. Yields first rose when the PBOC tightened policy to slow the credit boom in the period 2016-18, before falling sharply as markets discounted a significant policy easing in response to the COVID shock in 2020. Since, they have settled to pre-crisis levels, while short-dated US government bond yields have remained low, despite a very recent uptick.
Integration of Chinese banks into the global economic cycle explains the Chinese vs G7 gap
The Chinese government bond market developed since the early 2000s in a monetary and economic regime with little integration into the global economic and financial cycle. Although the shadow banking system has developed apace in China since the Global Financial Crisis, Chinese banks largely missed it, and there are only four Chinese banks in the Financial Stability Board’s list of the 30 Globally Systemically Important Banks[1] (G-SIBs). Thus, most of the asset growth in Chinese banks has come from lending to finance domestic growth. Therefore, low global asset exposure of Chinese banks makes the domestic economy and financial system less exposed to shocks in other jurisdictions.
The independence of Chinese monetary policy from the G7 is also important
In addition, China has had more limited exposure to this global financial cycle. This means Chinese interest rates and monetary policy have been set largely independently of the G7, and particularly since the GFC, by the PBOC. And unlike the G7, the Chinese financial system did not experience major regime change after the GFC, as G7 policy interest rates fell to zero (or below in some cases), and central banks adopted QE programs.
A major structural break occurred after the GFC Chinese interest rates and bond yields were quite closely correlated with those of the G7.
Experience since the COVID-19 shock has again shown continuing divergence between China and the G7, with China largely missing the second and third COVID waves that have bedeviled much of the G7. This meant Chinese GDP growth rebounded strongly in Q4 2020, reducing pressure on the PBOC to decrease interest rates further in 2021, after only a modest 30bps policy easing in Q1 2020, when the virus first appeared in China. Therefore, bond yields have remained more stable in China during the COVID-19 period, in contrast with the G7.
Read the paper or subscribe to our blog.
[1] Financial Stability Board 2020 list of G-SIBs; www.fsb.org/wp-content/uploads/P111120.pdf).
—
Originally Posted on November 16, 2021 – Explaining the Differences Between Chinese vs US Bond Yield Curve
Disclosure: FTSE Russell
Interactive Advisors, a division of Interactive Brokers Group, offers FTSE Russell Index Tracker portfolios on its online investing marketplace. Learn more about the Diversified Portfolios.
This material is not intended as investment advice. Interactive Advisors or portfolio managers on its marketplace may hold long or short positions in the companies mentioned through stocks, options or other securities.
© 2023 London Stock Exchange Group plc and its applicable group undertakings (the “LSE Group”). The LSE Group includes (1) FTSE International Limited (“FTSE”), (2) Frank Russell Company (“Russell”), (3) FTSE Global Debt Capital Markets Inc. and FTSE Global Debt Capital Markets Limited (together, “FTSE Canada”), (4) MTSNext Limited (“MTSNext”), (5) Mergent, Inc. (“Mergent”), (6) FTSE Fixed Income LLC (“FTSE FI”), (7) The Yield Book Inc (“YB”) and (8) Beyond Ratings S.A.S. (“BR”). All rights reserved.
FTSE Russell® is a trading name of FTSE, Russell, FTSE Canada, MTSNext, Mergent, FTSE FI, YB and BR. “FTSE®”, “Russell®”, “FTSE Russell®”, “MTS®”, “FTSE4Good®”, “ICB®”, “Mergent®”, “The Yield Book®”, “Beyond Ratings®“ and all other trademarks and service marks used herein (whether registered or unregistered) are trademarks and/or service marks owned or licensed by the applicable member of the LSE Group or their respective licensors and are owned, or used under licence, by FTSE, Russell, MTSNext, FTSE Canada, Mergent, FTSE FI, YB or BR. FTSE International Limited is authorised and regulated by the Financial Conduct Authority as a benchmark administrator.
All information is provided for information purposes only. All information and data contained in this publication is obtained by the LSE Group, from sources believed by it to be accurate and reliable. Because of the possibility of human and mechanical error as well as other factors, however, such information and data is provided “as is” without warranty of any kind. No member of the LSE Group nor their respective directors, officers, employees, partners or licensors make any claim, prediction, warranty or representation whatsoever, expressly or impliedly, either as to the accuracy, timeliness, completeness, merchantability of any information or of results to be obtained from the use of the FTSE Russell products, including but not limited to indexes, data and analytics or the fitness or suitability of the FTSE Russell products for any particular purpose to which they might be put. Any representation of historical data accessible through FTSE Russell products is provided for information purposes only and is not a reliable indicator of future performance.
No responsibility or liability can be accepted by any member of the LSE Group nor their respective directors, officers, employees, partners or licensors for (a) any loss or damage in whole or in part caused by, resulting from, or relating to any error (negligent or otherwise) or other circumstance involved in procuring, collecting, compiling, interpreting, analysing, editing, transcribing, transmitting, communicating or delivering any such information or data or from use of this document or links to this document or (b) any direct, indirect, special, consequential or incidental damages whatsoever, even if any member of the LSE Group is advised in advance of the possibility of such damages, resulting from the use of, or inability to use, such information.
No member of the LSE Group nor their respective directors, officers, employees, partners or licensors provide investment advice and nothing contained herein or accessible through FTSE Russell products, including statistical data and industry reports, should be taken as constituting financial or investment advice or a financial promotion.
Past performance is no guarantee of future results. Charts and graphs are provided for illustrative purposes only. Index returns shown may not represent the results of the actual trading of investable assets. Certain returns shown may reflect back-tested performance. All performance presented prior to the index inception date is back-tested performance. Back-tested performance is not actual performance, but is hypothetical. The back-test calculations are based on the same methodology that was in effect when the index was officially launched. However, back- tested data may reflect the application of the index methodology with the benefit of hindsight, and the historic calculations of an index may change from month to month based on revisions to the underlying economic data used in the calculation of the index.
This document may contain forward-looking assessments. These are based upon a number of assumptions concerning future conditions that ultimately may prove to be inaccurate. Such forward-looking assessments are subject to risks and uncertainties and may be affected by various factors that may cause actual results to differ materially. No member of the LSE Group nor their licensors assume any duty to and do not undertake to update forward-looking assessments.
No part of this information may be reproduced, stored in a retrieval system or transmitted in any form or by any means, electronic, mechanical, photocopying, recording or otherwise, without prior written permission of the applicable member of the LSE Group. Use and distribution of the LSE Group data requires a licence from FTSE, Russell, FTSE Canada, MTSNext, Mergent, FTSE FI, YB, BR and/or their respective licensors.
Disclosure: Interactive Brokers
Information posted on IBKR Campus that is provided by third-parties does NOT constitute a recommendation that you should contract for the services of that third party. Third-party participants who contribute to IBKR Campus are independent of Interactive Brokers and Interactive Brokers does not make any representations or warranties concerning the services offered, their past or future performance, or the accuracy of the information provided by the third party. Past performance is no guarantee of future results.
This material is from FTSE Russell and is being posted with its permission. The views expressed in this material are solely those of the author and/or FTSE Russell and Interactive Brokers is not endorsing or recommending any investment or trading discussed in the material. This material is not and should not be construed as an offer to buy or sell any security. It should not be construed as research or investment advice or a recommendation to buy, sell or hold any security or commodity. This material does not and is not intended to take into account the particular financial conditions, investment objectives or requirements of individual customers. Before acting on this material, you should consider whether it is suitable for your particular circumstances and, as necessary, seek professional advice.


