


We’ve previously asserted that Federal Reserve Chair Powell has a remarkable ability to morph into Goldilocks when necessary, and it appears that he utilized that superpower once again yesterday. The FOMC’s message did not seem particularly market-friendly – doubling the pace of tapering, a dot plot that indicates median estimates of three rate hikes over the next two years, and ditching the word “transitory” from the inflation discussion – but stocks rallied sharply and bonds recovered from early losses. The Fed told us when they anticipate taking away the proverbial punchbowl but the revelers didn’t seem to care.
We discussed the potential for the positive reaction to an unpleasant message yesterday. ”As I write this, we are experiencing our third straight day of selling. It is possible that traders’ expectations have been sufficiently suppressed to allow a bit of a relief rally if today’s messaging is less dire than feared.” The afternoon session indeed had the character of a relief rally, with stocks taking sequential legs higher as the likelihood of a scary answer during the press conference waned.
Bear in mind that the faster taper was likely factored in, something else we noted yesterday. There clearly was enough consensus that faster rate hikes could be part of the prescription as well. And while the “T-word” vanished from the FOMC’s statement, their median prediction for PCE inflation drops from 5.3% this year to 2.6% next year to 2.3%, 2.1% and 2.0% in the coming years. That seems like a wonderful way of saying inflation is transitory without using the actual word.
One might wonder how that prediction might be achieved. The answer appears to be a combination of hope that the worst of the global supply shocks will ease and faith that a series of target interest rate rises will do the trick. The chart below shows a better-formatted version of the dot plot contained in the FOMC statement:
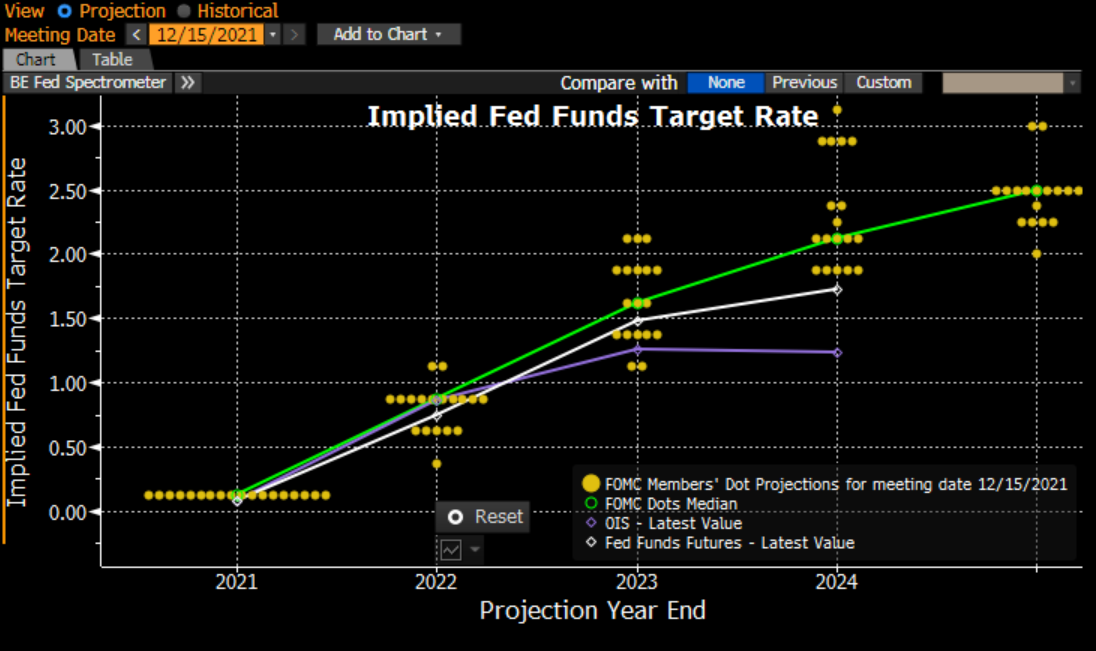
Source: Bloomberg
We see that the median projection (green line) showing 3 rate hikes in each of 2022 and 2023. That implies a rate expectation for the end of 2022 to be between 0.75 and 1%, and a median projection for the end of 2023 to be between 1.5 and 1.75%. We see that Fed Funds futures (white) roughly agree with those projections. The end of 2023 is roughly 2 years from now. Yet the 2-Year Treasury note is currently yielding about 0.625%. That seems like a significant disconnect.
We saw the 2-year note gyrate wildly in the aftermath of the FOMC meeting, as shown below:
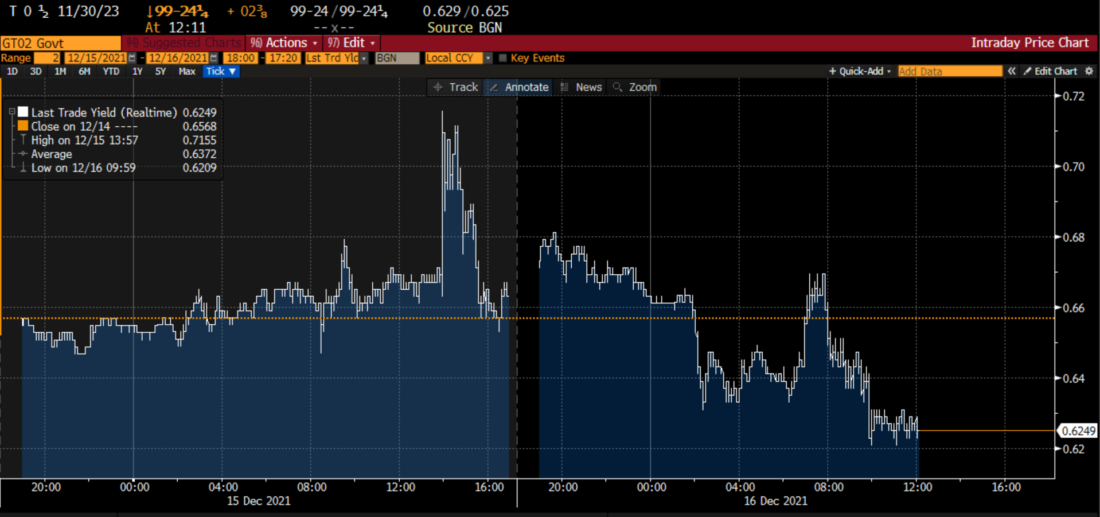
Source: Bloomberg
After a quick lurch to higher yields when the meeting statement was released, the 2 year note settled back to trade roughly unchanged. This morning we see rates decline slightly. Somehow, even as one portion of the fixed income markets shows a 1.5% rate projection, another shows 0.625% what gives?
Part of the explanation is that the 2 year T-note yield reflects an average of short-term rates over its life. But even so, the current rate seems to understate the situation. I think that the rest of the explanation can be found here:
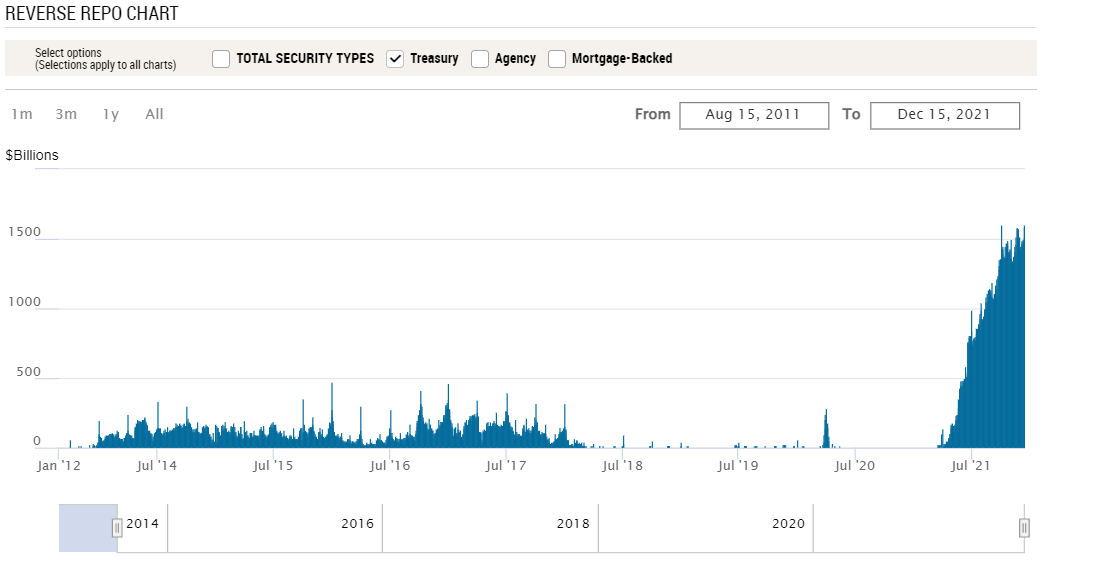
Source: Reverse Repo Operations – FEDERAL RESERVE BANK of NEW YORK (newyorkfed.org)
The chart above shows the amount of money being accepted each day for reverse repos by the New York Fed. Yesterday’s level was a record. Remember that reverse repo activity is a way of draining liquidity. Quite simply, there is a record amount of cash – about $1.6 trillion — sloshing around the system, seeking the risk-free 5 basis points offered by the Fed. Until that flow of funds is substantially reduced, we are likely to see the apparent distortions in short-term rates that we see now. Remember, even with an accelerated taper, the Fed is still buying bonds in the open market for another 3 months. It seems as though it will take more time than that to work through all the apparent excesses.
Disclosure: Interactive Brokers
The analysis in this material is provided for information only and is not and should not be construed as an offer to sell or the solicitation of an offer to buy any security. To the extent that this material discusses general market activity, industry or sector trends or other broad-based economic or political conditions, it should not be construed as research or investment advice. To the extent that it includes references to specific securities, commodities, currencies, or other instruments, those references do not constitute a recommendation by IBKR to buy, sell or hold such investments. This material does not and is not intended to take into account the particular financial conditions, investment objectives or requirements of individual customers. Before acting on this material, you should consider whether it is suitable for your particular circumstances and, as necessary, seek professional advice.
The views and opinions expressed herein are those of the author and do not necessarily reflect the views of Interactive Brokers, its affiliates, or its employees.


