


Yesterday, we wrote how investors’ fixation with round numbers included the CBOE Volatility Index’ (VIX) recent, brief flirtation with the 20 level. Granted, it only managed to crack that number for the final 3 minutes of the trading day last Friday, but its timing seemed auspicious – at least when the US left for a 3-day weekend. By yesterday, we saw the index bounce back to around 21.5 on a day when major indices mostly meandered, seemingly rendering moot the low volatility theme for the time being. Yet while most of the media attention focused on the level of the spot VIX index, out of the limelight, futures were telling us a very different story about the potential return of volatility in upcoming months.
Consider the graph below:
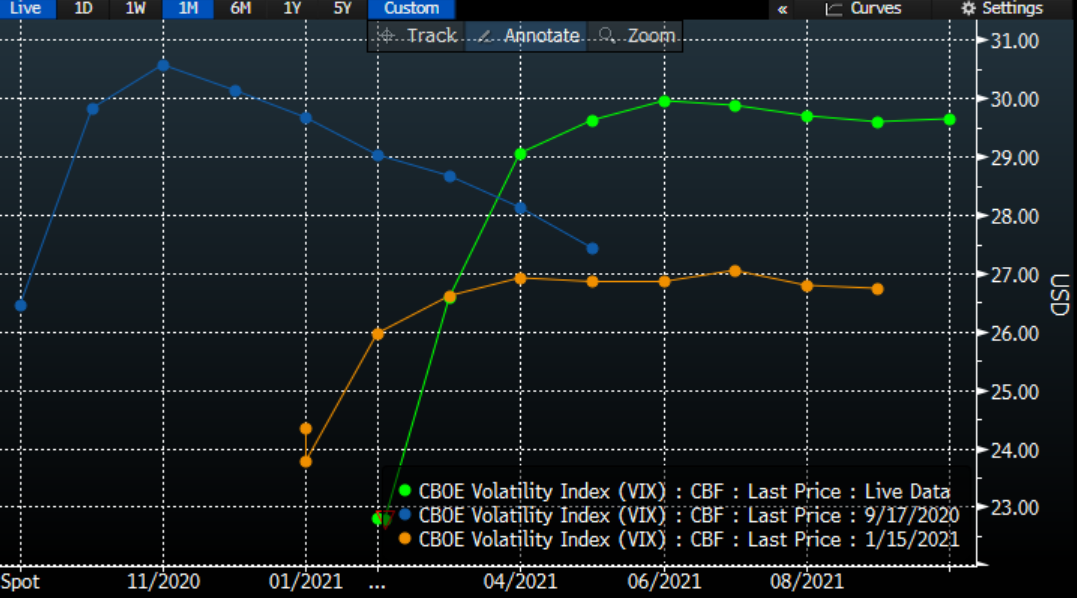
VIX Futures Curves: Current (green), 1 Month Ago (orange), 5 Months Ago (blue)
Source: Bloomberg
We see that the futures curve has steepened dramatically, resembling the shape that it maintained in the weeks leading up to the 2020 election. At the time we noted, along with others, that the election and its aftermath had the potential to be a volatility inducing event. That proved to be the case. The post-election rally eventually pushed 7 day historical volatility for the S&P 500 (SPX) over 35 before subsiding over the ensuing weeks. We can argue that VIX futures traders more or less got it right.
So we have to ask ourselves what those traders see over the coming months that leads them to anticipate a similarly large bump in volatility over the coming months. When we compare the orange line to the green line in the graph above, we see that that the curve’s steepness rose sharply since last month. Something about the market’s expectations for future volatility has changed over the past few weeks. There is no obvious catalyst like an election to boost expectations, though. We can see that the market is concerned about something, though it is hard to see what that might be.
The stimulus bill is the most significant piece of potentially market-moving news that is likely to emerge in the coming weeks. Markets are fixated on stimulus, and rightly so. We have discussed how fiscal stimulus was a key catalyst behind last year’s market rebound and many economic commentators have linked today’s surprising 5.3% jump in January retail sales to the recent $600 checks. At one point, investors viewed the upcoming proposal to be a slam-dunk, with bi-partisan support for most of its tenets. As with much in DC, bi-partisanship proved to be fleeting, with Republican Senators lining up in opposition to the bill and some Democratic Senators showing dismay with some of its specifics.
I can see three potential problems surrounding the bill’s passage that could be causing unease. First, the bill could take longer to become law than originally anticipated. Markets appear to have priced in the imminent, speedy passage of the bill, but in light of the objections that we noted, that might be a more time-consuming process than we thought. Second, the bill may be less encompassing than anticipated. Investors appear to have been pricing in a minimum of $1400 checks and a wide range of other economic support. Again, if the negotiations continue to find new sticking points, those may turn out to be resolved via compromises that would dilute the bill’s effectiveness. Third, investors could be looking at the stimulus bill as a “buy the rumor, sell the news” event. This is what I believe to be the most likely concern.
Traders have long memories. Sometimes not long enough, but most remember three years ago. At that time, major indices had been rising in anticipation of the Trump tax cuts. Those were signed at the end of 2017, and markets continued to rise throughout January 2018. VIX was flirting with single digits, and it appeared that the run would continue indefinitely. That narrative was upturned in early February 2018. Major indices plunged by 10% or more, and the ensuing rise in volatility came to be known as “Volmageddon”. In hindsight, the tax cuts proved to be a major “buy the rumor, sell the news” event.
Of course no two markets are the same. The levels of implied volatility across a wide range of options were historically low, almost freakishly so. We see a very different setup now, with rampant call speculation pushing implied volatilities – particularly on out of the money calls – to levels above historic norms. But it is important to remember that while history doesn’t repeat, it often rhymes. There may be other explanations for the steep VIX curve that will emerge over the coming days, or the curve may settle back to a more normal shape, but “buy the rumor, sell the news” seems to be the narrative that fits best right now.
Disclosure: Interactive Brokers
The analysis in this material is provided for information only and is not and should not be construed as an offer to sell or the solicitation of an offer to buy any security. To the extent that this material discusses general market activity, industry or sector trends or other broad-based economic or political conditions, it should not be construed as research or investment advice. To the extent that it includes references to specific securities, commodities, currencies, or other instruments, those references do not constitute a recommendation by IBKR to buy, sell or hold such investments. This material does not and is not intended to take into account the particular financial conditions, investment objectives or requirements of individual customers. Before acting on this material, you should consider whether it is suitable for your particular circumstances and, as necessary, seek professional advice.
The views and opinions expressed herein are those of the author and do not necessarily reflect the views of Interactive Brokers, its affiliates, or its employees.
Disclosure: Options Trading
Options involve risk and are not suitable for all investors. Multiple leg strategies, including spreads, will incur multiple commission charges. For more information read the "Characteristics and Risks of Standardized Options" also known as the options disclosure document (ODD) or visit ibkr.com/occ
Disclosure: Futures Trading
Futures are not suitable for all investors. The amount you may lose may be greater than your initial investment. Before trading futures, please read the CFTC Risk Disclosure. A copy and additional information are available at ibkr.com.


