


Alibaba reported fiscal year Q2 results prior to the US open. Alibaba’s fiscal year is different than the calendar year which explains why this is the company’s Q2 and not Q3. Expectations going into the release had been dropping as the company talked down analysts’ expectations. This led me to believe we might get a kitchen sink quarter i.e., the company writes down/off knowing the quarter isn’t going to be great. Alibaba ripped the band-aid as the cost of revenues increased to RMB 129.75B ($20.137B) from Q2 2020’s RMB 89.96B while sales/marketing expense increased to RMB 28.857B ($4.479B) from Q2 2020’s RMB 17.371B. Below you’ll notice big declines and disparities between GAAP and non-GAAP/adjusted in net income and EPS versus results a year ago.
Alibaba’s investments in publicly traded stocks are required to be written down by GAAP accounting rules. Analysts will focus on non-GAAP/adjusted net income and EPS as the company can’t control if the stock market goes up or down. The big three numbers, revenue/adjusted net income/adjusted EPS, missed analyst expectations. The company is investing heavily in its core business which resulted in increased expenses. The reality is Alibaba faces increased competition from JD.com, ByteDance’s Douyin, and others.
Ultimately, I don’t think the results are as bad as the headlines as management has navigated a tough economic and regulatory environment. Management made sure to emphasize that annual revenue guidance remains the same with expectations between 20% to 23%. It is worth noting the company bought 269mm shares in Q3. While the stock will be off today, this might be the final flush in BABA. % changes compare this quarter to the same quarter last year.
- Revenue increased +29% to RMB 200.69B versus analyst estimate of RMB 206.173B
- Revenue by segmentation: China retail commerce increased 33% to RMB 126.827B ($19.683B) accounting for 63% of revenue
- International retail commerce increased 33% to RMB 10.375B ($1.61B) driven by Lazada, a SE Asia focused business line, and AliExpress
- Total commerce increased 31% to RMB 171.17B ($26.565B) accounting for 85% of revenue
- Cloud computing increased 33% to RMB 20.007B ($3.105B)
- Annual active customers increased by 62mm to 1.24B
- Total costs/expenses increased 2% to RMB 185.684B ($28.818B)
- Net Income declined -87% to RMB 3.377B ($524mm)
- Adjusted Net Income declined 81% to RMB 5.367B ($833mm) versus analyst estimates of RMB 33.2B
- EPS declined -81% to RMB 1.97 ($0.31) versus analyst expectation of RMB 8.16
- Adjusted EPS declined -38% to RMB 1.40 ($0.22) versus analyst estimate of RMB 12.37
- During the quarter, the company bought back 26.9mm shares at a cost of $5.147B
- Cash increased to RMB 443.428B ($68.819B) versus end of June’s RMB 470.824B
- Fiscal year 2022 revenue is expected to grow between 20% to 23%
JD.com’s decision to report earnings on the same day and same time as Alibaba was an indication that management was ready to rumble. The results absolutely smashed analyst expectations. There was a GAAP net income and EPS loss versus a non-GAAP/adjusted gain. The company’s stock-based compensation expense increased which GAAP accounting considers a cash cost. Analysts will focus on the adjusted/non-GAAP for net income and EPS as growth companies tend to pay employees with stock. Like Alibaba, JD had to write down investments in publicly headed companies which created, along with the employee stock, a big disparity between GAAP versus non-GAAP/adjusted net income and EPS.
- Revenue increased 25.5% to RMB 218.7B ($33.9B)
- Virtually all of JD.com’s revenue comes from its JD Retail which increased to RMB 198.080B ($30.741B) from RMB 161.081B with electronics/home appliances accounting for RMB 110.881B ($17.208B)
- Annual active customers increased 25% to 552.2mm for the year ended September 30th
- Expenses rose across the board (cost of revenues, fulfillment, marketing, R&D, general/administrative) which lowered income from operations to RMB 2.572B ($399mm) from Q3 2020’s RMB 4.383B
- GAAP Net income was a loss of RMB 2.806B along with GAAP EPS of RMB 1.81 (-$0.28)
- Adjusted Net income was a gain of RMB 5.047B ($783mm) versus analyst expectations of RMB 3.264B
- Adjusted EPS RMB 3.16 ($0.49) versus analyst expectations of RMB 3.16
Key News
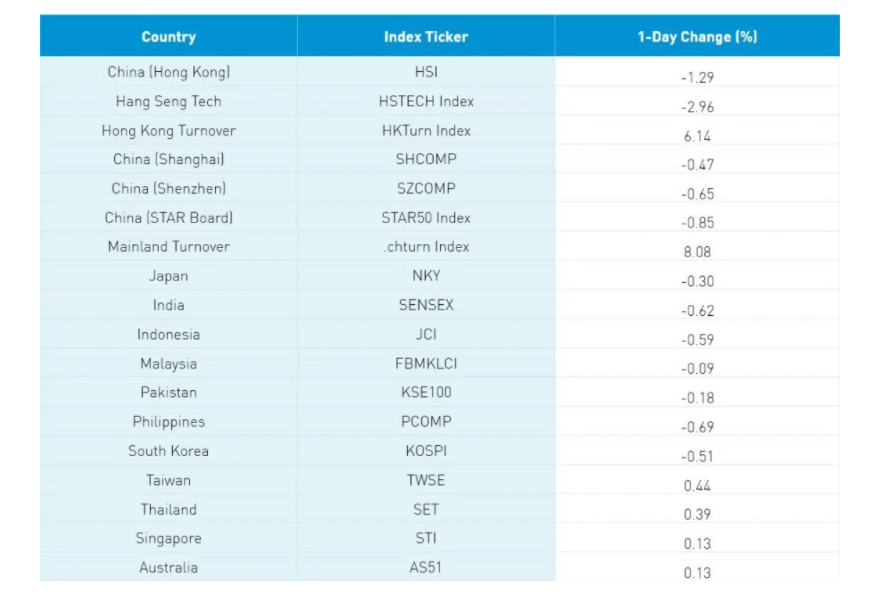
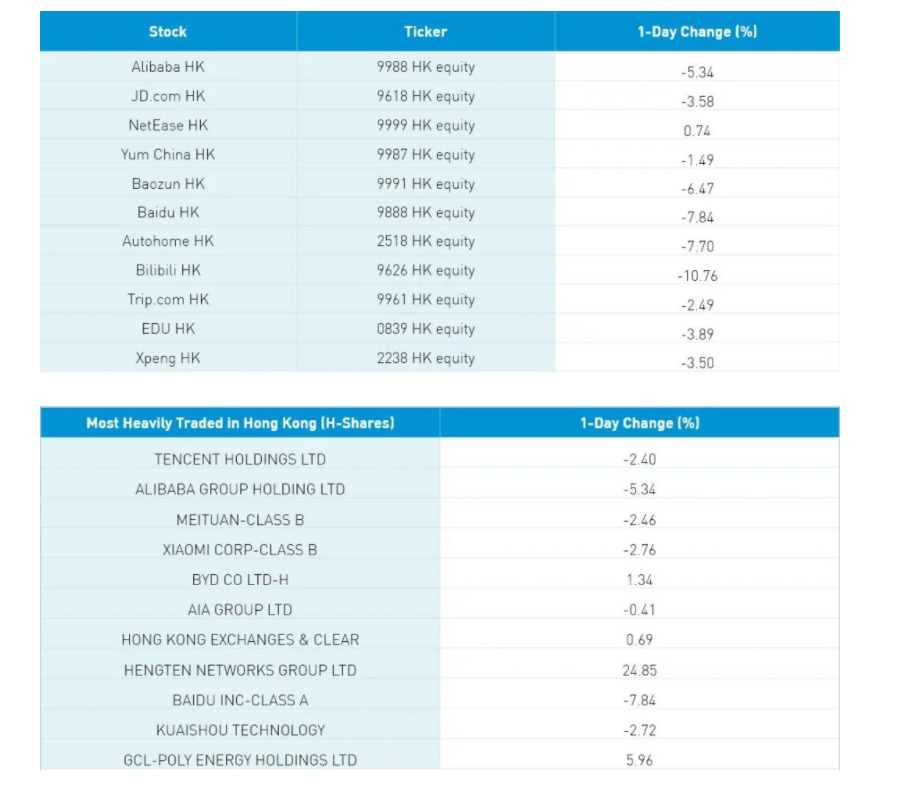
Asian equities followed the US market south overnight. India’s blockbuster IPO of Paytm (PAYTM IN) opened with a thud as shares fell -27.4%, weighing on India’s market. Hong Kong was led lower by internet stocks with Tencent -2.4%, Alibaba HK -5.34%, and Meituan -2.46% following an off day yesterday in US trading. It was a broad sell-off with nearly 4 to 1 decliners to advancers. NetEase did manage a gain in the US yesterday and overnight in Hong Kong as investors cheered the company’s Q3.
US-listed Chinese internet stocks were off following Baidu and IQ’s quarterly results along with “soft” results from Singapore based gaming/e-commerce giant Sea Limited. The space fell further when the US-China Economic and Security Review Commission, a group that provides research to Congress, released their annual report recommending that Congress ban US investors from investing in China. No one believes this will be enacted but it shows the McCarthy era-like environment in DC. The commission is stacked with China bears so the output isn’t surprising. The analysis provides shockingly little coverage of how well US companies are doing in China. The biggest culprit from yesterday was likely nervousness about Alibaba’s results.
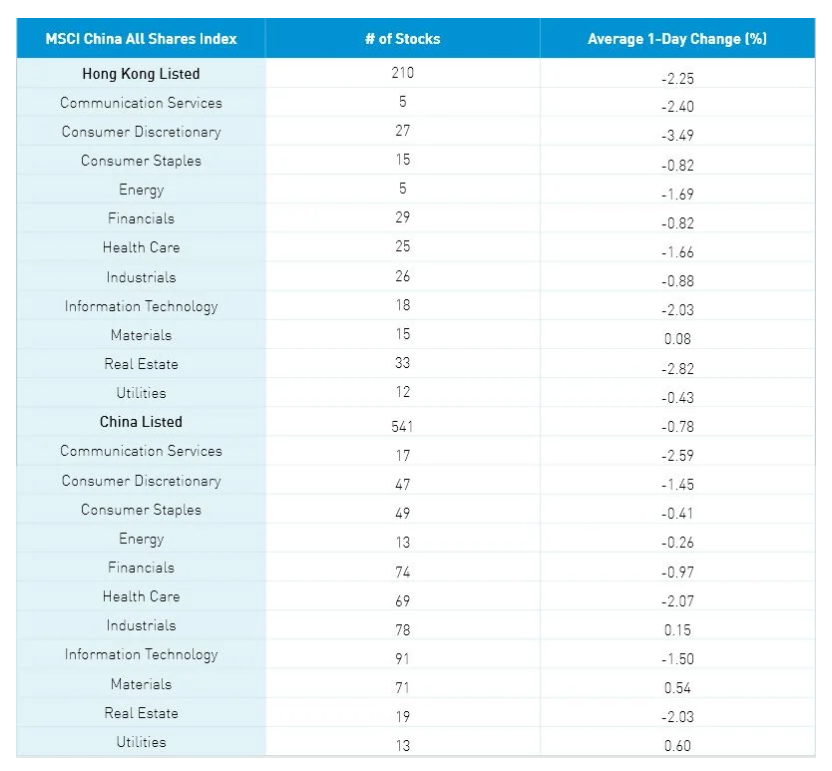
Hong Kong’s growth sectors were off with discretionary -3.5%, communication -2.41%, and tech -1.7% with only materials pulling a James Bond +0.07%. Real estate was off in Hong Kong -2.83% as Country Garden (2007 HK) sold shares to raise cash though the company’s bonds have been resilient considering investors’ risk-off attitude to the space. Tencent was a net sell in Southbound Stock Connect while Meituan was a net buy (again). Mainland China was off with Shanghai -0.47%, Shenzhen -0.65%, and STAR Board -0.85% as growth sectors also lagged.
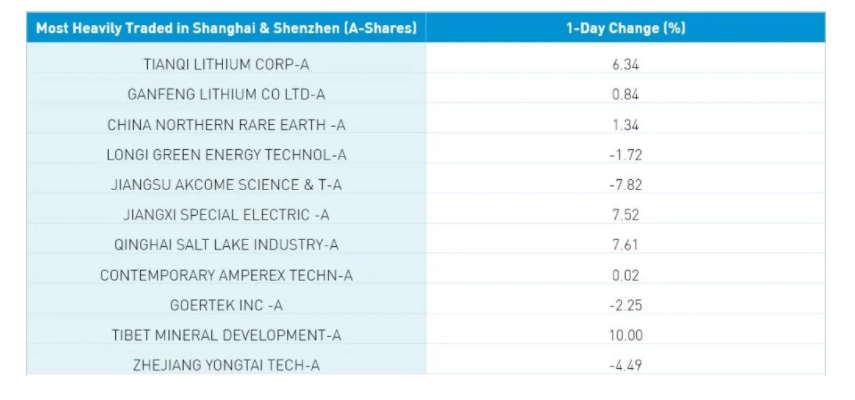
The clean technology ecosystem was a bright spot though a few individual names saw profit-taking after yesterday’s strong move. There was talk about government support of the hydrogen industry as an alternative to EV though it was balanced with verbal support for the EV batteries. Hydrogen is abundant and clean though not economically viable so throwing some R&D money to explore makes sense to me. There was no clear catalyst for today’s weakness though the PBOC only replaced half of the expiring repos with new repos leading to a net drain of liquidity in the system. There was also regulators’ warning about metaverse enthusiasm, called yuancosmos in China, as several names have gone parabolic despite little fundamentals. Foreign investors sold -$697mm of Mainland stocks today while CNY eased a touch versus the US $, bonds rallied, and copper down more than -1%.
Last Night’s Exchange Rates, Prices, & Yields
- CNY/USD 6.38 versus 6.38 yesterday
- CNY/EUR 7.24 versus 7.22 yesterday
- Yield on 10-Year Government Bond 2.91% versus 2.93% yesterday
- Yield on 10-Year China Development Bank Bond 3.18% versus 3.19% yesterday
- Copper Price -1.33% overnight
—
Originally Posted on November 18, 2021 – A Tale of Two E-Commerce Giants
Author Positions as of 11/18/21 are KBA, KALL, KCNY, KFYP, KCNY, KEMQ, BZUN, HSBC, KWEB, KHYB
Disclosure: KraneShares
Content on China Last Night is for informational purposes only and should not be construed as investment advice. This material represents an assessment of the market environment at a specific time and is not intended to be a forecast of future events or a guarantee of future results; material is as of the dates noted and is subject to change without notice. This information should not be relied upon by the reader as research or investment advice regarding the funds or any security in particular.
This material may not be suitable for all investors and is not intended to be an offer, or the solicitation of any offer, to buy or sell any securities. Investing involves risk, including possible loss of principal.
This material contains general information only and does not take into account an individual’s financial circumstances. This information should not be relied upon as a primary basis for an investment decision. Rather, an assessment should be made as to whether the information is appropriate in individual circumstances and consideration should be given to talking to a financial advisor before making an investment decision.
Forward-looking statements (including Krane’s opinions, expectations, beliefs, plans, objectives, assumptions, or projections regarding future events or future results) contained in this presentation are based on a variety of estimates and assumptions by Krane. These statements generally are identified by words such as “believes,” “expects,” “predicts,” “intends,” “projects,” “plans,” “estimates,” “aims,” “foresees,” “anticipates,” “targets,” “should,” “likely,” and similar expressions. These also include statements about the future, including what “will” happen, which reflect Krane’s current beliefs. These estimates and assumptions are inherently uncertain and are subject to numerous business, industry, market, regulatory, geo-political, competitive, and financial risks that are outside of Krane’s control. The inclusion of forward-looking statements herein should not be regarded as an indication that Krane considers forward-looking statements to be a reliable prediction of future events and forward-looking statements should not be relied upon as such. Neither Krane nor any of its representatives has made or makes any representation to any person regarding forward-looking statements and neither of them intends to update or otherwise revise such forward-looking statements to reflect circumstances existing after the date when made or to reflect the occurrence of future events, even in the event that any or all of the assumptions underlying such forward-looking statements are later shown to be in error. Any investment strategies discussed herein are as of the date of the writing of this presentation and may be changed, modified, or exited at any time without notice.
Disclosure: Interactive Brokers
Information posted on IBKR Campus that is provided by third-parties does NOT constitute a recommendation that you should contract for the services of that third party. Third-party participants who contribute to IBKR Campus are independent of Interactive Brokers and Interactive Brokers does not make any representations or warranties concerning the services offered, their past or future performance, or the accuracy of the information provided by the third party. Past performance is no guarantee of future results.
This material is from KraneShares and is being posted with its permission. The views expressed in this material are solely those of the author and/or KraneShares and Interactive Brokers is not endorsing or recommending any investment or trading discussed in the material. This material is not and should not be construed as an offer to buy or sell any security. It should not be construed as research or investment advice or a recommendation to buy, sell or hold any security or commodity. This material does not and is not intended to take into account the particular financial conditions, investment objectives or requirements of individual customers. Before acting on this material, you should consider whether it is suitable for your particular circumstances and, as necessary, seek professional advice.
Disclosure: Forex
There is a substantial risk of loss in foreign exchange trading. The settlement date of foreign exchange trades can vary due to time zone differences and bank holidays. When trading across foreign exchange markets, this may necessitate borrowing funds to settle foreign exchange trades. The interest rate on borrowed funds must be considered when computing the cost of trades across multiple markets.
Disclosure: Futures Trading
Futures are not suitable for all investors. The amount you may lose may be greater than your initial investment. Before trading futures, please read the CFTC Risk Disclosure. A copy and additional information are available at ibkr.com.


