


Markets were caught off-guard after yesterday’s close when Fitch Ratings cut the United States’ credit rating from AAA to AA+. My initial reaction was “Bottom line: bad news, but not catastrophic.” That said, it appears to be a big splash of cold water in the faces of complacent traders.
The ratings cut shouldn’t have come as too big of a surprise. Fitch put the US on ratings watch two months ago, meaning that a downgrade became a possibility back then. It is probably no coincidence that the cut occurred one day after the Treasury raised its July-September borrowing estimate to $1 trillion from the prior estimate of $733 billion. An extra $277 billion here and there add up to some real money, no?
Bond traders paid close attention to the additional borrowing yesterday. We saw 2-year yields rise by more than 2 basis points, 10-year yields rise by more than 6 bp, and 30-year yields rise by more than 8 bp. Much of the new borrowing will be done via longer-term debt, so it is understandable why the far end of the yield curve rose faster. That trend has continued apace today, with 2’s, 10’s and 30’s up 1bp, 7.5bp and 9bp respectively.
Yet stocks, as had become customary, largely ignored the message from the bond market yesterday. The S&P 500 Index (SPX) and Nasdaq 100 (NDX) each fell by about a quarter-percent. Even then I got some questions asking why the market was lower, with the implication being that it was unusual to see that. And by recent standards, it has indeed been somewhat unusual.
Even more unusual, if it holds, would be a 1% drop in SPX. We haven’t had a down day of -1% or more in that index since May 2nd. NDX has been on a bit more of a roller-coaster ride, posting a drop of -2.28% on July 20th on the back of poorly received earnings from Tesla (TSLA) and Netflix (NFLX), though that dip was both preceded and followed by jumps of only somewhat smaller magnitudes. Overall, neither index has made too much upward progress since the middle of July. Consolidation after a period of rapid gains is to be expected.
21 Day Chart, SPX (red/green bars), NDX (blue line)
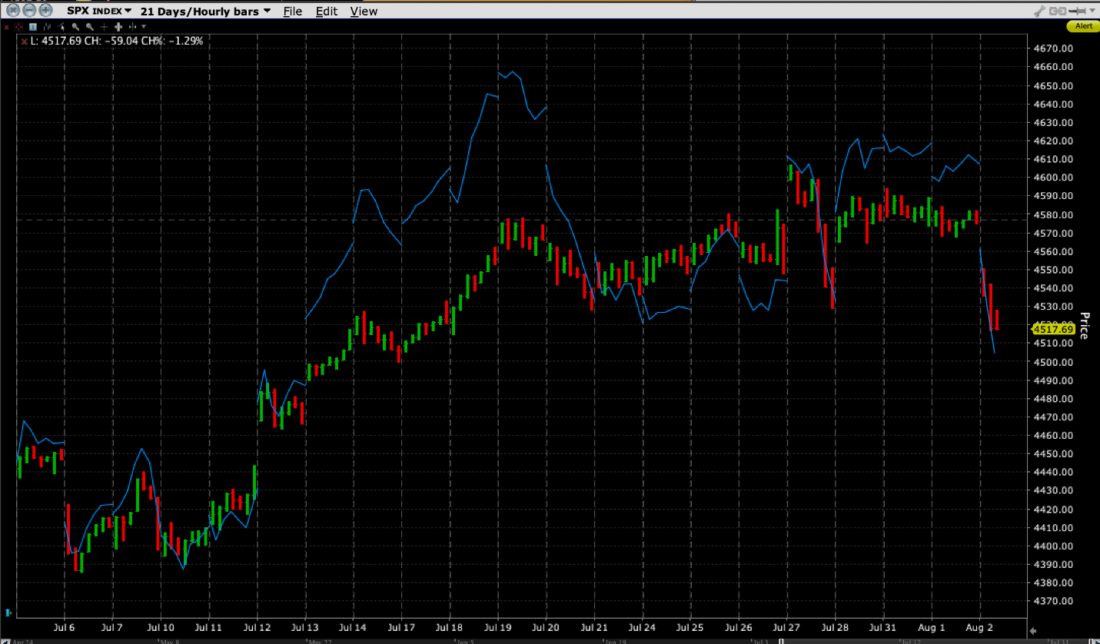
Source: Interactive Brokers
Even though any selloffs over the past month have tended to be brief and quickly reversed, it is useful to note the swings in the Cboe Volatility Index (VIX) over that same period:
21 Day Chart, VIX (red/green bars)
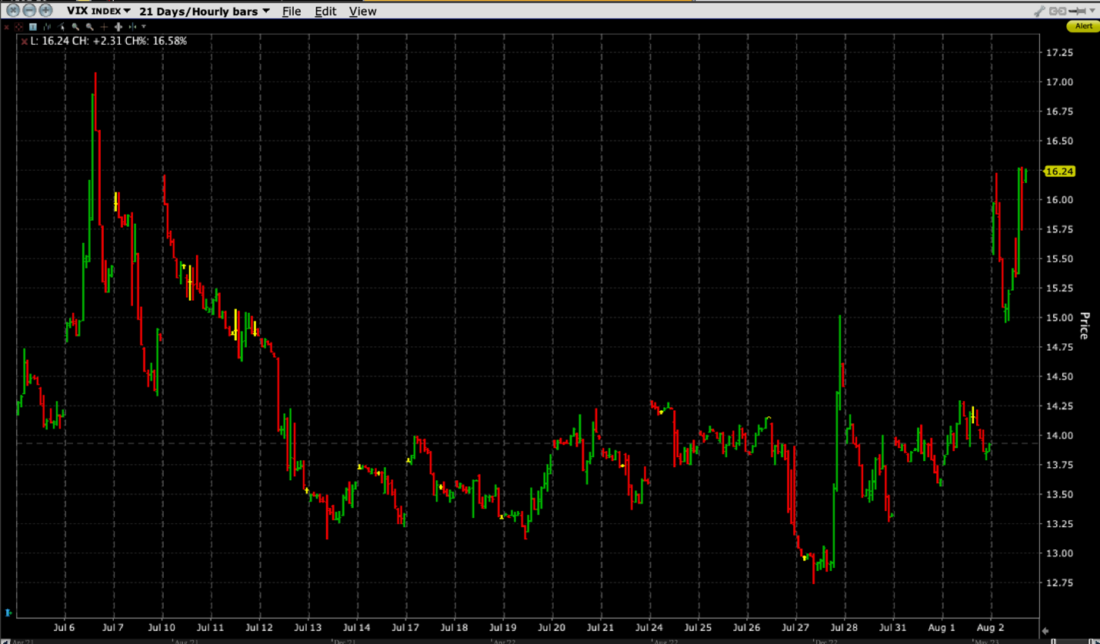
Source: Interactive Brokers
Note the spikes in VIX that occurred on July 6th and 28th. At the highs of the 6th, VIX had popped almost three points from its prior day’s close. That peak coincided with SPX’s intraday low of about 1.5% below its prior close. SPX recovered about half its drop by that day’s close, and as the benchmark index rose steadily over the ensuing days, VIX gave back all its gains and then some. The message that resonated with volatility traders was not that VIX tends to reverse declines very abruptly; instead it was that volatility would resume its declines as long as the market continued to rise.
The move on the 28th occurred just after VIX missed setting a new low for the year during that morning. The low for 2023 was set on June 22nd when VIX touched 12.73. The low on July 28th was 12.74. After robust opening rallies for NDX and SPX, we saw a quick drop after the Nikkei report that the Bank of Japan (BOJ) would indeed be relaxing its yield curve control policies at its meeting that morning. Interestingly, few market participants actually knew the real cause for the market’s decline – they saw quick selling and raced for volatility protection. I appeared on television that afternoon, noting that VIX had jumped from about 12.90 to 14.50 in just two hours.
Relative complacency is fine, until it’s not. I’ve used the analogy that options market makers are in the business of selling parachutes. Business picks up in a hurry when the airplane hits turbulence.
I’d like to think that traders took to heart our findings in yesterday’s piece, noting that August tends to the best month for VIX on a historical basis. It has averaged a 10.42% jump over the past 25 years, with the index rising 15 of 25 times. So far this month we are up over 18% — in just one and a half days. The 3.5-point rise is hardly historic, but percentage changes look even bigger when the starting point is low.
It’s not clear that the downgrade will prove to be a meaningful negative catalyst over the longer term. If nothing else, it is less shocking than Standard & Poor’s move in 2011. But if the combination of far higher Treasury borrowing along with the downgrade is enough to get sanguine stock traders to pay attention to the bond market’s more cautious message, that can have profound consequences for those who have become complacent about equities’ risks.
Join The Conversation
If you have a general question, it may already be covered in our FAQs. If you have an account-specific question or concern, please reach out to Client Services.
Leave a Reply
Disclosure: Interactive Brokers
The analysis in this material is provided for information only and is not and should not be construed as an offer to sell or the solicitation of an offer to buy any security. To the extent that this material discusses general market activity, industry or sector trends or other broad-based economic or political conditions, it should not be construed as research or investment advice. To the extent that it includes references to specific securities, commodities, currencies, or other instruments, those references do not constitute a recommendation by IBKR to buy, sell or hold such investments. This material does not and is not intended to take into account the particular financial conditions, investment objectives or requirements of individual customers. Before acting on this material, you should consider whether it is suitable for your particular circumstances and, as necessary, seek professional advice.
The views and opinions expressed herein are those of the author and do not necessarily reflect the views of Interactive Brokers, its affiliates, or its employees.


that’s two notches down as it is AAA, AAA-, and then AA+, so it is very signicant.
why would anyone take what Fitch or S&P proclaim. What did they do in 2008 when bankers were bringing down the economy? that’s right they continued to rate failing mortgage securities as AAA. The rating agencie should be shut down not attention paid to the ratings.
Good synopsis – thanks
Thank you, Robert!
The earnings are higher then estimates, because of the expected interest rate hurt on the economy everyone made them lower… In terms of inflation many companies are not growing earnings from 2019
Thank you for contributing, Peter.