


By Todd Stankiewicz CMT, CFP, ChFC
1/ FOMC Conundrum?
2/ Line in the Sand for the Dow Jones Industrial Average
3/ Seasonality
Investopedia is partnering with CMT Association on this newsletter. The contents of this newsletter are for informational and educational purposes only, however, and do not constitute investing advice. The guest authors, which may sell research to investors, and may trade or hold positions in securities mentioned herein do not represent the views of CMT Association or Investopedia. Please consult a financial advisor for investment recommendations and services.
1/
FOMC Conundrum?
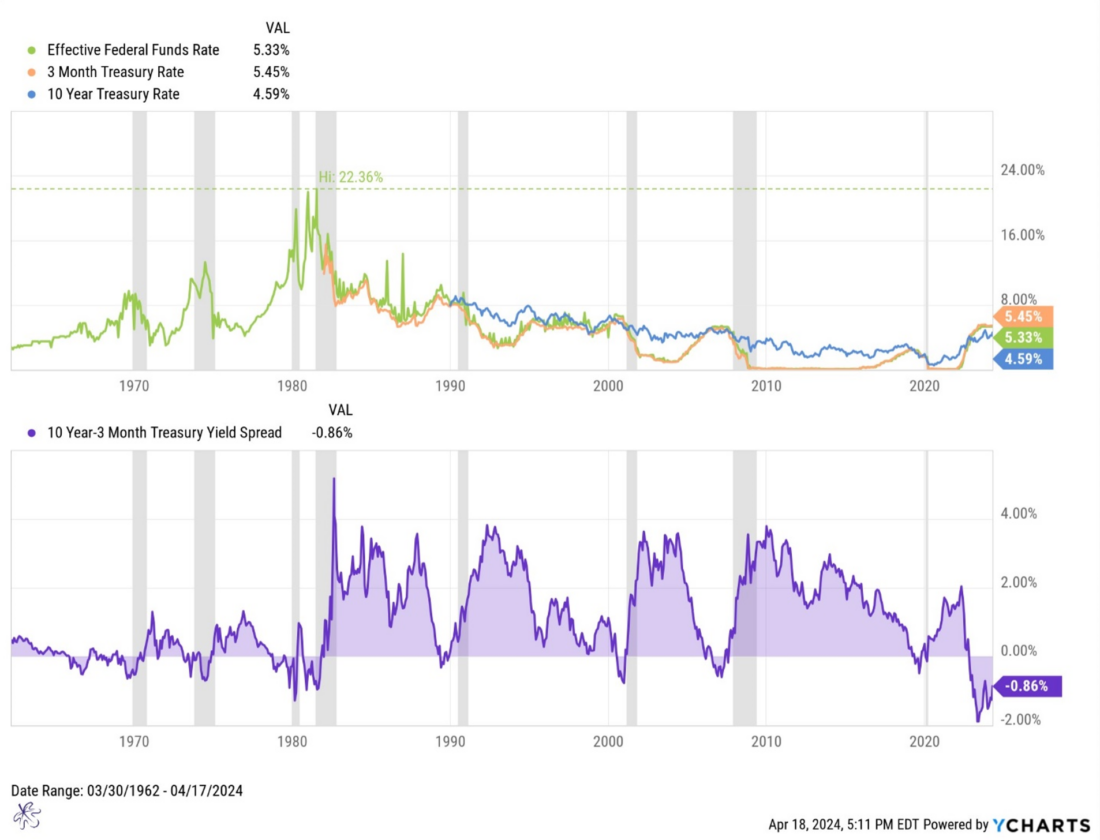
Many investors are looking for the FOMC to cut rates, but do we really want a rate cut? The economy cannot operate in an inverted yield curve environment permanently. The curve needs to normalize. Unfortunately, this cannot happen unless the FOMC brings down short-term rates. Historically the Effective Fed Fund rate has been cut just preceding or coinciding with a recession. Since the 1960’s there has not been one meaningful rate cutting cycle that has not been followed by a recession. Based on history, a Fed rate cut may not be the gift everyone is hoping for.
2/
Line in the Sand for the Dow Jones Industrial Average

The Dow Jones industrial average has broken the midpoint of the Bollinger band. It is finding weekly support at the previous resistance levels (yellow line). Intra week, it can be observed that the index tried to rally above the Middle Bollinger Band but failed. A move below this recent support would put the lower Bollinger band in play at 365.73.
3/
Seasonality


Sell in May and go away is the famous saying. The top chart represents seasonality of the S&P500 index over the past 20 years. The April though July period is one of the most favorable periods for the S&P500. It closes higher, 80%, 74%, 58% and 79% respectively. The next three months are among the worst for the index, from August through October.
Conversely, treasury yields close lower most of the time in July and August. Due to the inverse relation with bond prices, this makes these the two most attractive months to own treasuries based on seasonality.
It may be more appropriate to say, sell in July and buy in November, and don’t forget about those bonds.
—
Originally posted 19th April, 2024
Disclosure: Investopedia
Investopedia.com: The comments, opinions and analyses expressed herein are for informational purposes only and should not be considered individual investment advice or recommendations to invest in any security or to adopt any investment strategy. While we believe the information provided herein is reliable, we do not warrant its accuracy or completeness. The views and strategies described on our content may not be suitable for all investors. Because market and economic conditions are subject to rapid change, all comments, opinions and analyses contained within our content are rendered as of the date of the posting and may change without notice. The material is not intended as a complete analysis of every material fact regarding any country, region, market, industry, investment or strategy. This information is intended for US residents only.
Disclosure: Interactive Brokers
Information posted on IBKR Campus that is provided by third-parties does NOT constitute a recommendation that you should contract for the services of that third party. Third-party participants who contribute to IBKR Campus are independent of Interactive Brokers and Interactive Brokers does not make any representations or warranties concerning the services offered, their past or future performance, or the accuracy of the information provided by the third party. Past performance is no guarantee of future results.
This material is from Investopedia and is being posted with its permission. The views expressed in this material are solely those of the author and/or Investopedia and Interactive Brokers is not endorsing or recommending any investment or trading discussed in the material. This material is not and should not be construed as an offer to buy or sell any security. It should not be construed as research or investment advice or a recommendation to buy, sell or hold any security or commodity. This material does not and is not intended to take into account the particular financial conditions, investment objectives or requirements of individual customers. Before acting on this material, you should consider whether it is suitable for your particular circumstances and, as necessary, seek professional advice.


Join The Conversation
If you have a general question, it may already be covered in our FAQs. If you have an account-specific question or concern, please reach out to Client Services.