


By J.C. Parets & All Star Charts
Friday, 14th October, 2022
1/ Consolidations Resolve Lower
2/ Health Care Holds Up
3/ Relative Strength From Regional Banks
4/ The Juice Is Loose
Investopedia is partnering with All Star Charts on this newsletter, which both sells its research to investors, and may trade or hold positions in securities mentioned herein. The contents of this newsletter are for informational and educational purposes only, however, and do not constitute investing advice.
1/ Consolidations Resolve Lower
Many of the market’s weakest areas and cycle laggards bottomed early in the summer and have been stuck in prolonged sideways formations ever since. The big question on the minds of technical analysts is whether these consolidations could turn out to be continuation patterns or reversals.
A handful of ARK ETFs appear to be giving us some insights this week.

The above chart shows the ARK Innovation (ARKK), ARK Internet (ARKW), and ARK Fintech (ARKF) ETFs all pressing to new lows and violating the lower bounds of their ranges.
These multi-month consolidations displayed in the chart could be continuation patterns, breaking lower in the direction of the underlying trend. If these new lows hold, we could expect these groups to experience a fresh leg to the downside in the coming weeks.
2/ Health Care Holds Up
Health care stocks have held up better than most throughout the volatility this week. This type of relative strength is nothing new, as large-cap health care stocks are trading at fresh multi-year highs against the broader market.
While the sector is outperforming on a relative basis, it still isn’t experiencing any uptrend. Here is the Large Cap Health Care Sector SPDR (XLV) trading in a sideways range amid a potential topping pattern:

The choppy price action continued this week, as evidenced by a wide-ranging, small-bodied candle on the weekly chart. While it may not meet the textbook definition of a doji candle, given that the opening and closing prices are not equal, it is similar in essence. This type of price action signals indecision between buyers and sellers, as neither highs nor lows can hold and price ends up back to where it started.
In a market where all sectors are experiencing downward pressure, simply trading sideways can be considered leadership.
3/ Relative Strength From Regional Banks
Earlier this week, we mentioned the impressive relative strength from homebuilders. Regional banks represent another economically-sensitive group showing leadership right now.
The chart below shows the SPDR Regional Banking ETF (KRE) reaching its highest level since March of 2021 relative to the S&P 500 (SPY).
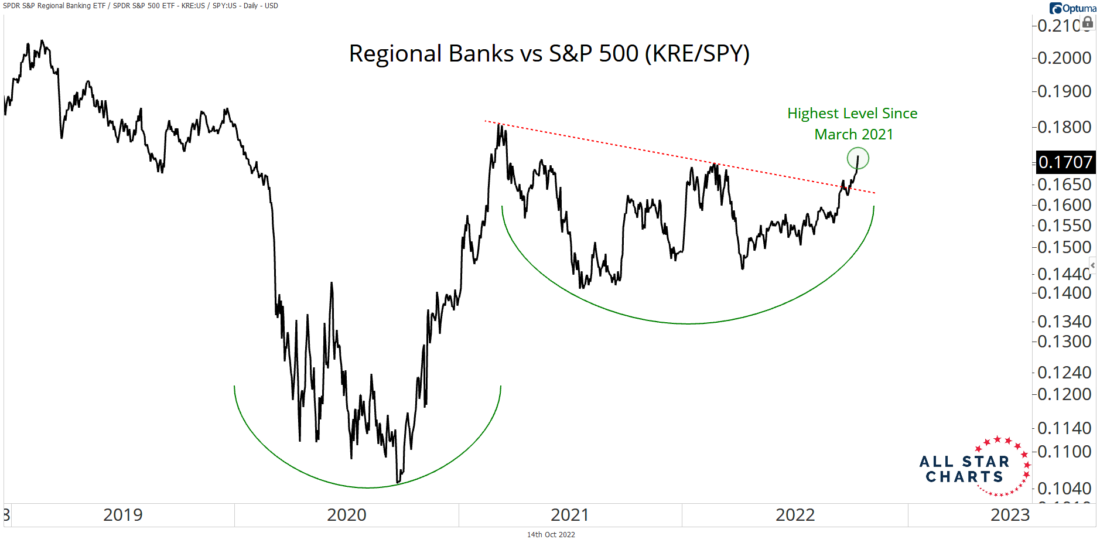
Like homebuilders, outperformance from regional banks and other risk-on sectors is not the type of behavior we would expect to see if the market was about to break down.
Continued outperformance from KRE could be a positive for the bulls moving forward. If this base breakout in KRE/SPY is a valid one, we could expect more leadership from these stocks in the future.
4/ The Juice Is Loose
There’s always a bull market somewhere. All we have to do is look for uptrend lines and base breakouts, such as the one currently in orange juice futures.

The above chart provides a classic example of a breakout to fresh highs, followed by a retest of former resistance. In this case, the principle of polarity kicked in as former resistance turned into support.
As long as newfound support holds, the path of least resistance could be higher for OJ.
It’s hard to find a data point more bullish than a multi-month base breakout to fresh multi-year highs.
—
Originally posted 14th October, 2022
Disclosure: Investopedia
Investopedia.com: The comments, opinions and analyses expressed herein are for informational purposes only and should not be considered individual investment advice or recommendations to invest in any security or to adopt any investment strategy. While we believe the information provided herein is reliable, we do not warrant its accuracy or completeness. The views and strategies described on our content may not be suitable for all investors. Because market and economic conditions are subject to rapid change, all comments, opinions and analyses contained within our content are rendered as of the date of the posting and may change without notice. The material is not intended as a complete analysis of every material fact regarding any country, region, market, industry, investment or strategy. This information is intended for US residents only.
Disclosure: Interactive Brokers
Information posted on IBKR Campus that is provided by third-parties does NOT constitute a recommendation that you should contract for the services of that third party. Third-party participants who contribute to IBKR Campus are independent of Interactive Brokers and Interactive Brokers does not make any representations or warranties concerning the services offered, their past or future performance, or the accuracy of the information provided by the third party. Past performance is no guarantee of future results.
This material is from Investopedia and is being posted with its permission. The views expressed in this material are solely those of the author and/or Investopedia and Interactive Brokers is not endorsing or recommending any investment or trading discussed in the material. This material is not and should not be construed as an offer to buy or sell any security. It should not be construed as research or investment advice or a recommendation to buy, sell or hold any security or commodity. This material does not and is not intended to take into account the particular financial conditions, investment objectives or requirements of individual customers. Before acting on this material, you should consider whether it is suitable for your particular circumstances and, as necessary, seek professional advice.
Disclosure: ETFs
Any discussion or mention of an ETF is not to be construed as recommendation, promotion or solicitation. All investors should review and consider associated investment risks, charges and expenses of the investment company or fund prior to investing. Before acting on this material, you should consider whether it is suitable for your particular circumstances and, as necessary, seek professional advice.
Disclosure: Futures Trading
Futures are not suitable for all investors. The amount you may lose may be greater than your initial investment. Before trading futures, please read the CFTC Risk Disclosure. A copy and additional information are available at ibkr.com.


