By C. Theodore Hicks II, CFP, CKA, CMT
1/ GDP
2/ Reaction
3/ Fed Funds
4/ Ten Year Treasury
5/ Secular Bear
Investopedia is partnering with CMT Association on this newsletter. The contents of this newsletter are for informational and educational purposes only, however, and do not constitute investing advice. The guest authors, which may sell research to investors, and may trade or hold positions in securities mentioned herein do not represent the views of CMT Association or Investopedia. Please consult a financial advisor for investment recommendations and services.
1/
GDP
Courtesy of Optuma
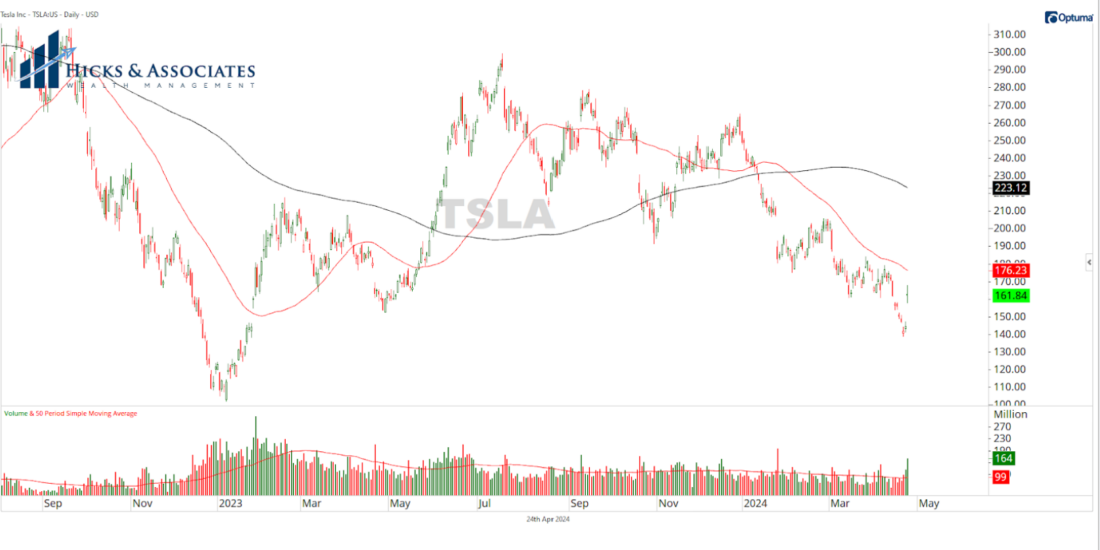
Yesterday, the US Bureau of Economic Analysis released their “advance estimate” for GDP for the first quarter of 2024. Economists were expecting to see 2.4% but the advance estimate came in at 1.6%.
As expected, the crackpot news media did their thing writing stories about this dismal GDP report. One major news outlet stated that this GDP report “marks a sharp slowdown from the 3.4% pace seen during the fourth quarter. It is the slowest growth in two years.”
Correct. That’s what the Fed is trying to accomplish, you geniuses!
Chairman Powell and the Federal Reserve are trying to get inflation under control by slowing the economy down but without causing a recession. One could easily argue that Chairman Powell is doing a good job with this objective … so far.
(Full disclosure, yes, I agree, Chairman Powell and his compatriots took too long to start raising rates. No, I do not think they’ve gotten every decision right. But, Lord knows, neither have I. Nor have you.)
2/
Reaction

Courtesy of Optuma
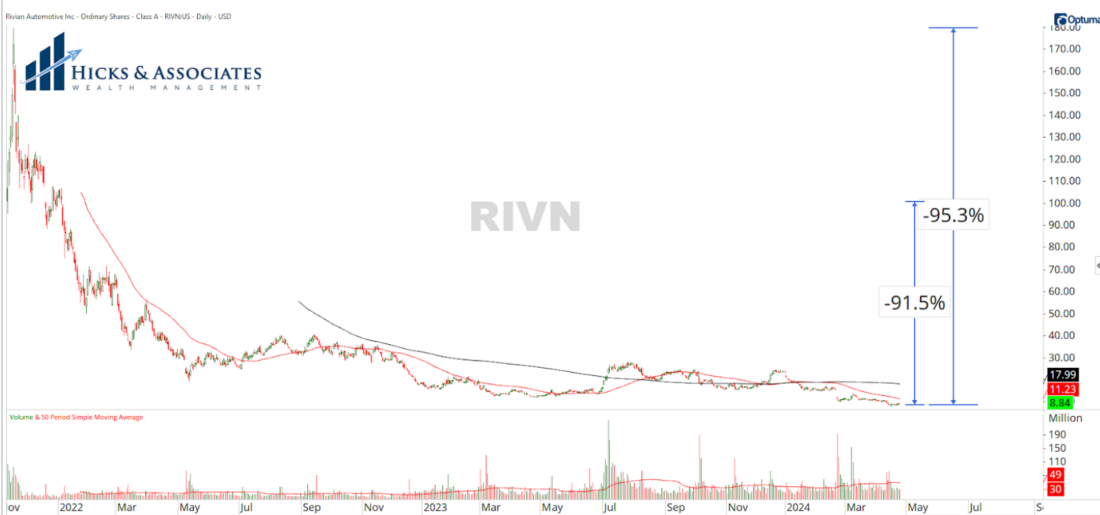
For Chart 2, I’m showing both the 5-minute (left) and the daily (right) candle chart for SPY, the SPDR S&P 500 ETF. The gray box on the left is highlighting the day’s trading with everything before and after representing pre and post-market hours.
Initially, the US equities markets sold off on the GDP news, but immediately began to rally. This is a great example of why I prefer to look at the charts myself as opposed to just reading the news. The journalists are going to report that the S&P 500 lost about .40% on the day. However, when you look at the close as compared to the open, the close was ~0.8% higher. If you examine the close as compared to the low of the day, the close was 1.2% higher. While it is accurate to say that the S&P 500 lost .40% on the day, I would argue that it is journalistic malpractice to spin that as a bad day. The rally off the initial reaction was pretty strong.
3/
Fed Funds

Courtesy of Optuma
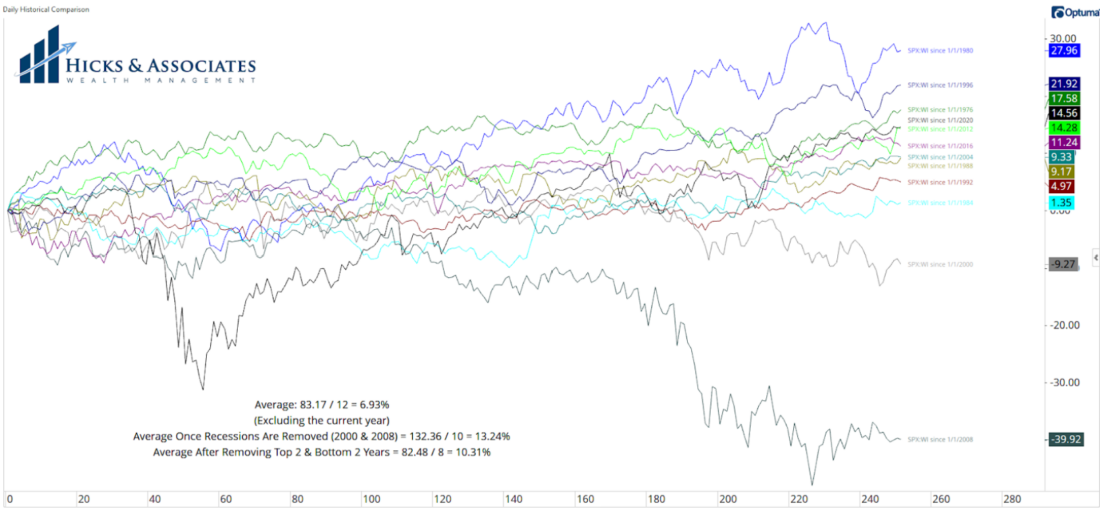
We started the year off with many expecting the Federal Reserve to cut rates multiple times. Some were even expecting fairly aggressive rate cuts.
As the first quarter began drawing to a close, the narrative began to change. In order to squash inflation, one could argue that the Federal Reserve may actually need to raise rates. If the GDP report came in at 2.4% as expected or the 3.4% pace that we saw in the fourth quarter, Chairman Powell would have a lot of justification in raising rates. The fact that GDP came in positive but slower than expected could easily be viewed as good news. So far, they are slowing the economy and – so far – we have avoided a recession.
4/
Ten Year Treasury

Courtesy of Optuma
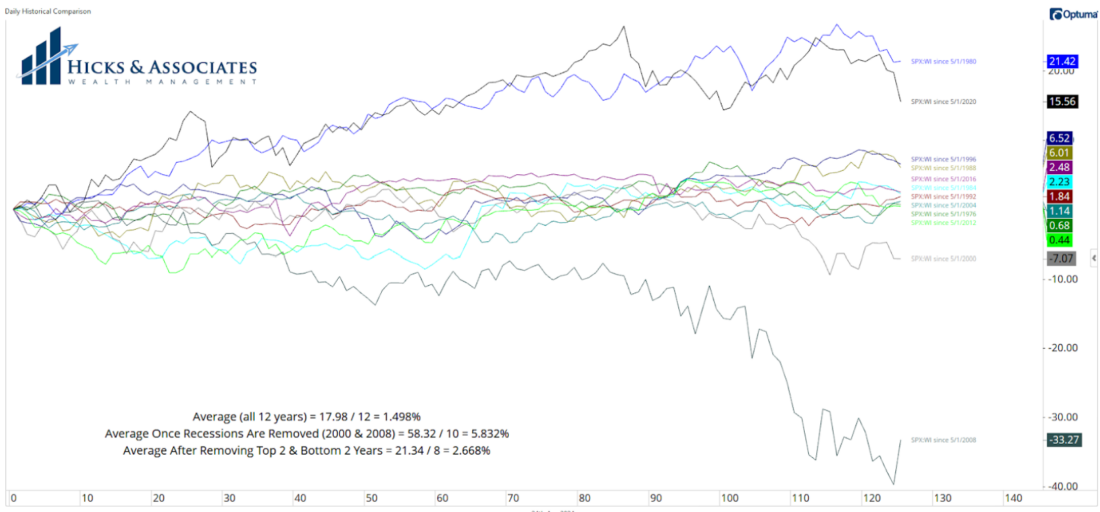
In examining history, we can see that the 10-year Treasury yield – the blue line in Chart 4 – is pretty heavily correlated to the Fed Funds rate (green line). Based on this correlation, one could make an argument that we do not need the Federal Reserve setting interest rates; we could just let the free market decide and use the 10-year Treasury yield instead.
With this historic context in mind, the 10-year Treasury yield does suggest that it might be appropriate for the Fed Funds rate to be cut; perhaps just not as aggressively as some were hoping.
5/
Secular Bear


Courtesy of Optuma
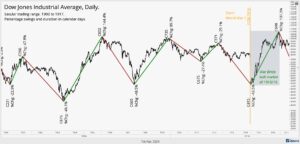
This brings us to Chart 5 which is showing the S&P 500 from 1965 through 1979. This time period was a particularly nasty secular bear market. Yes, the US stock market had cyclical bull phases within this secular bear. But there is no doubt that this time period was an incredibly tough time period for investors.
One of the key contributing factors to this time period was the record high inflation – the record persistently high inflation. As a money manager for individuals and families, I have to have an investment management strategy that can help us navigate through something similar to what is seen on Chart 5. Naturally, if we are not in a secular bear market, our investment strategy has to navigate that environment too. So while I would love to see our economy growing faster, I definitely want to see inflation under control. As a result, I consider yesterday’s GDP report to be good news.
—
Originally posted 26th April, 2024
Disclosure: Investopedia
Investopedia.com: The comments, opinions and analyses expressed herein are for informational purposes only and should not be considered individual investment advice or recommendations to invest in any security or to adopt any investment strategy. While we believe the information provided herein is reliable, we do not warrant its accuracy or completeness. The views and strategies described on our content may not be suitable for all investors. Because market and economic conditions are subject to rapid change, all comments, opinions and analyses contained within our content are rendered as of the date of the posting and may change without notice. The material is not intended as a complete analysis of every material fact regarding any country, region, market, industry, investment or strategy. This information is intended for US residents only.
Disclosure: Interactive Brokers
Information posted on IBKR Campus that is provided by third-parties does NOT constitute a recommendation that you should contract for the services of that third party. Third-party participants who contribute to IBKR Campus are independent of Interactive Brokers and Interactive Brokers does not make any representations or warranties concerning the services offered, their past or future performance, or the accuracy of the information provided by the third party. Past performance is no guarantee of future results.
This material is from Investopedia and is being posted with its permission. The views expressed in this material are solely those of the author and/or Investopedia and Interactive Brokers is not endorsing or recommending any investment or trading discussed in the material. This material is not and should not be construed as an offer to buy or sell any security. It should not be construed as research or investment advice or a recommendation to buy, sell or hold any security or commodity. This material does not and is not intended to take into account the particular financial conditions, investment objectives or requirements of individual customers. Before acting on this material, you should consider whether it is suitable for your particular circumstances and, as necessary, seek professional advice.
















Join The Conversation
If you have a general question, it may already be covered in our FAQs. If you have an account-specific question or concern, please reach out to Client Services.