


As emerging market (EM) equities continue to lag those of developed markets (DM), a question we sometimes get is “why have the stock markets for ‘higher growth’ emerging markets lagged developed markets so much in the last decade?”. A key reason is that higher GDP growth has not translated into corresponding corporate earnings growth for emerging markets.
As shown in the chart below, DM stocks as a group have significantly outperformed EM stocks over much of the last 10 years, including the most recent period since February of this year. The returns shown are based on the benchmark MSCI Emerging Markets and MSCI World (developed markets) indices, using total returns in US dollars. Since February 2012, the MSCI World Index has had a cumulative total return of approximately 220% (or 12.7% per year), while the Emerging Markets index has returned only about 58% (or 4.8% per year).
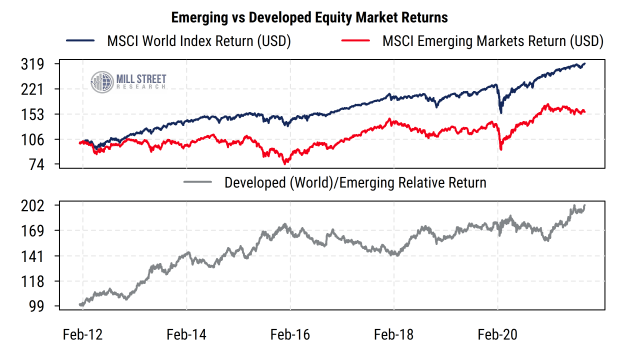
Source: Mill Street Research, Factset
This seems somewhat strange in light of the fact that real GDP growth in emerging economies has been much higher than that of developed economies over this period. According to IMF data on GDP growth, between 2012 and 2022 (estimated), emerging economies as a group grew real GDP at an average annual rate of about 4.2%, while developed economies grew at an average rate of just 1.8% per year. Even accounting for the differences in equity weightings in benchmark indices versus GDP weightings in the IMF aggregates, it may seem strange that such a large difference in economic growth rates would not be reflected in relative equity returns, and in fact the opposite has been true.
The picture becomes clearer when we step away from GDP data and focus on actual corporate earnings for the companies in the equity indices. The chart below shows the evolution of forward (next 12 month) consensus earnings for the two representative ETFs that track the MSCI EM and World indices, with ticker symbols EEM (for the EM index) and URTH (for the World index). The data start when URTH first launched nearly 10 years ago. Despite the seemingly higher GDP growth rates, EM earnings are just now returning to levels first seen 10 years ago (and have plateaued recently), while DM earnings are far ahead and still rising to new all-time highs. So EM’s 10-year underperformance trend has a clear fundamental driver visible in the relative paths of corporate earnings.
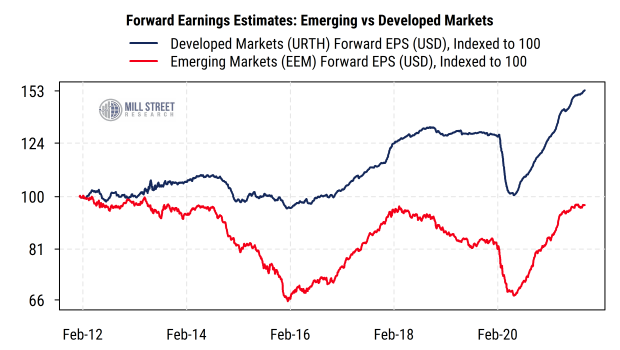
Source: Mill Street Research, Factset
This result is not uncommon, and highlights the importance for equity investors of not getting too focused on broad economic aggregates like GDP data (which are often of debatable quality in emerging economies) and keeping a closer eye on the bottom-up aggregated earnings (and especially revisions to earnings estimates) and other fundamentals that will tend to be much more relevant for equity holders. It remains the case that “stock markets are not GDP futures”, and many studies have found little or no relationship between a country or region’s GDP growth and its relative equity market returns. And of course, there are always many potential differences between aggregate economic measures and corporate earnings growth. Over the last decade investors have clearly responded to the trend in relative earnings growth between EM and DM stocks and largely ignored the apparent higher reported GDP growth rates for EM.
—
Originally Posted on November 4, 2021 – Do Emerging Markets Really Have Higher Growth
Disclosure: Mill Street Research
Source for data and statistics: Mill Street Research, FactSet, Bloomberg
This report is not intended to provide investment advice. This report does not constitute an offer or solicitation to buy or sell any securities discussed herein in any jurisdiction where such offer or solicitation would be prohibited. Past performance is not a guarantee of future results, and no representation or warranty, express or implied, is made regarding future performance of any security mentioned in this report.
All information, opinions and statistical data contained in this report were obtained or derived from public sources believed to be reliable, but Mill Street does not represent that any such information, opinion or statistical data is accurate or complete. All estimates, opinions and recommendations expressed herein constitute judgments as of the date of this report and are subject to change without notice.
Disclosure: Interactive Brokers
Information posted on IBKR Campus that is provided by third-parties does NOT constitute a recommendation that you should contract for the services of that third party. Third-party participants who contribute to IBKR Campus are independent of Interactive Brokers and Interactive Brokers does not make any representations or warranties concerning the services offered, their past or future performance, or the accuracy of the information provided by the third party. Past performance is no guarantee of future results.
This material is from Mill Street Research and is being posted with its permission. The views expressed in this material are solely those of the author and/or Mill Street Research and Interactive Brokers is not endorsing or recommending any investment or trading discussed in the material. This material is not and should not be construed as an offer to buy or sell any security. It should not be construed as research or investment advice or a recommendation to buy, sell or hold any security or commodity. This material does not and is not intended to take into account the particular financial conditions, investment objectives or requirements of individual customers. Before acting on this material, you should consider whether it is suitable for your particular circumstances and, as necessary, seek professional advice.


