


Equity markets have made a startling turnaround over the past week. Just a few days ago, we were all wondering whether it was significant that major indices were experiencing a 5% correction. Now that we have rallied about 5% in a week to a new high in the S&P 500 (SPX), it appears that any concerns have been largely eliminated.
One Month Chart, S&P 500 Index (SPX, red/green hourly bars) and NASDAQ 100 Index (NDX, blue line)
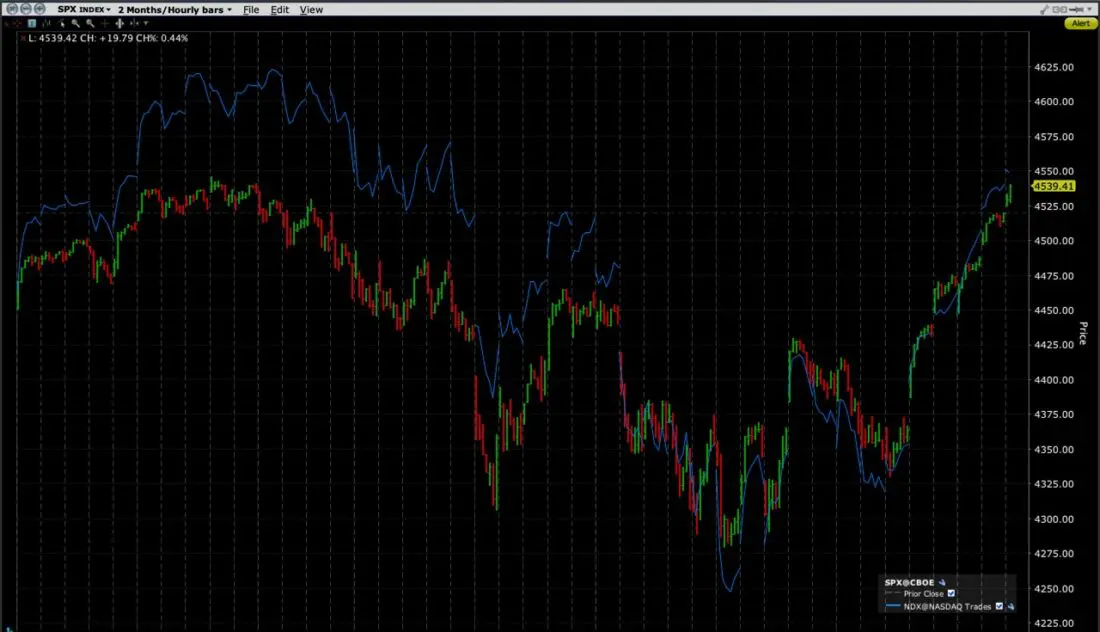
Source: Interactive Brokers
Although the more tech heavy NDX has failed to recoup its old highs so far, it has kept pace during the recent bounce. Even though many can argue that the stocks that make up the bulk of the NDX’ weight are somewhat inflation-resistant, SPX has a greater weighting of companies like that benefit from inflation, like energy stocks.
As stunning as the reversal in major indices has been, the psychological flip from worried to complacent is equally eye-catching. Note the plunge in the Cboe Volatility Index (VIX) to near its post-COVID lows over the same period:
One Year Chart, VIX (red/green bars) and SPX (blue line)

Source: Interactive Brokers
While faithful readers should be familiar with my assertion that VIX is not specifically the market’s “fear gauge”, VIX can function as a short-hand for trader’s views about risk over the coming sessions. As SPX reversed, VIX plunged from about 20 to about 15.5. I’ve never been a fan of the term “risk-on rally”, it is quite clear that traders have been flocking to riskier assets like stocks (and crypto) and leaving classic defensive assets behind. We have also seen investors flocking to more bullish options bets, with the put/call ratio falling below 0.50. While the put/call ratio has a very spotty predictive record, it can be a solid read about investor intentions.
Interestingly, traders appear to be much less sanguine about the coming months than they are about the current situation. VIX futures have fallen as markets rose, but the curve is quite steep, as shown in the graph below:
VIX Futures Curves (top): Today (yellow), Yesterday (orange), 1 Week Ago (red), 2 Weeks Ago (green), 1 Month Ago (magenta) with Comparisons vs Today (bottom)

Source: Interactive Brokers
It should be readily apparent that the back end of the curve (representing next year) remains quite stable while short-term futures have plunged. Remember that VIX is a measure of 30-day anticipated volatility. It appears that traders are sanguine about earnings over the next few weeks and about the possibility that the Federal Reserve could begin tapering its bond purchases as soon as early November. These are events that are covered by the spot VIX assumption. And while November and December futures have fallen substantially, they are trading at a significant premium to the spot index. The steepness is unusual, though I would argue that it is not irrational. VIX futures traders almost certainly realize that the debt ceiling negotiations will need to resume in the weeks immediately after November expiration. They seem to be exhibiting some caution that the recurring specter of a government shutdown could spook markets once again later this year, before resuming their concerns that tapering and possible interest rate hikes could bring volatility back into equity markets.
Over the past week, stocks have successfully climbed the latest wall of worry. It appears that options traders are speculating that the wall has been conquered for now, though they see the worries’ potential return in the coming months.
Disclosure: Interactive Brokers
The analysis in this material is provided for information only and is not and should not be construed as an offer to sell or the solicitation of an offer to buy any security. To the extent that this material discusses general market activity, industry or sector trends or other broad-based economic or political conditions, it should not be construed as research or investment advice. To the extent that it includes references to specific securities, commodities, currencies, or other instruments, those references do not constitute a recommendation by IBKR to buy, sell or hold such investments. This material does not and is not intended to take into account the particular financial conditions, investment objectives or requirements of individual customers. Before acting on this material, you should consider whether it is suitable for your particular circumstances and, as necessary, seek professional advice.
The views and opinions expressed herein are those of the author and do not necessarily reflect the views of Interactive Brokers, its affiliates, or its employees.
Disclosure: Options Trading
Options involve risk and are not suitable for all investors. Multiple leg strategies, including spreads, will incur multiple commission charges. For more information read the "Characteristics and Risks of Standardized Options" also known as the options disclosure document (ODD) or visit ibkr.com/occ
Disclosure: Futures Trading
Futures are not suitable for all investors. The amount you may lose may be greater than your initial investment. Before trading futures, please read the CFTC Risk Disclosure. A copy and additional information are available at ibkr.com.


