


I recently had the privilege of being interviewed for this Bloomberg article, wondering why strategists have widely differing views about the rest of 2023 and noting that many failed to anticipate the tenacity of this year’s rebound after a very difficult 2022. As with most articles of this type, because of space constraints and the need to get multiple viewpoints, the reporters used a fraction of our discussion. Here is a fuller version of my thoughts on the surprising year to date.
One of the most basic tenets of investing is “don’t fight the Fed.” Simply put, one should be constructive on stocks when the monetary tide is flowing in, and cautious when it’s flowing out. Being bullish on equities in the face of the sharpest rate hikes in a generation alongside persistent quantitative tightening flies in the face of that logic.
Yet, what most people failed to recognize was the resilience of the job market and American consumer. The Phillips Curve seems to be of little value, if any, in the current environment, since there has been essentially no relationship between employment and rates. People are keeping their jobs and finding it generally easy to get them when they want them. It makes them able to spend money and invest their excess funds in their favorite stocks.
Furthermore, last year’s declines did little to dissuade individual investors from chasing their favorite stocks, especially when we can add a sexy story like artificial intelligence (AI). That led to narrow leadership by the mega-cap tech stocks that dominate major market capitalization weighted indices, obscuring the generally lackluster performance by the average stock. While the S&P 500 Index (SPX) was up nearly 15% year-to-date as of yesterday, the equal-weighted SPX (SPW) was up just over 6%. And the soon-to-be-less-top-heavy NASDAQ 100 (NDX) is up 37.5% in that time frame.
We noted early this year that we were in the midst of one of the most spectacular “January effects” that we had seen in quite some time. The drastic sell-off that we saw into the end of 2022, propelled by tax-loss harvesting after a tough year, led to a quick and powerful reversal as the calendar turned. That said, we didn’t appreciate how fully sentiment would turn once the rally took hold. Nothing reinforces the idea of higher prices more than higher prices.
Bear in mind that the bond market got it wrong too. The yield curve has been screaming recession for months, but none has been forthcoming. Inverted yield curves, when longer-term rates are less than shorter rates, have been generally foolproof recession indicators throughout history. The inversion between 2- and 10- year yields has recently shrunk to 90 basis points, about 15 bp below its steepest near-record levels, but that still indicates significant recession concerns among bond investors. Remember, many equity investors take their economic cues from bonds.
A major positive wildcard actually came from the banking crisis in March. It seems perverse to think that the sequential failures of Silvergate (SICP), Silicon Valley Bank (SIVBQ), Signature Bank (SBNY) and Credit Suisse were market positives, but indeed they proved to be. The Federal Reserve and Treasury did an admirable job in keeping the crisis from metastasizing, but in doing so, the Fed extended about $300 billion in loans to the banking system. Those loans are carried on the Fed’s balance sheet as assets, expanding it quickly and undoing a significant piece of the recent quantitative tightening. Much of that added liquidity almost immediately found its way into stocks once the crisis was averted.
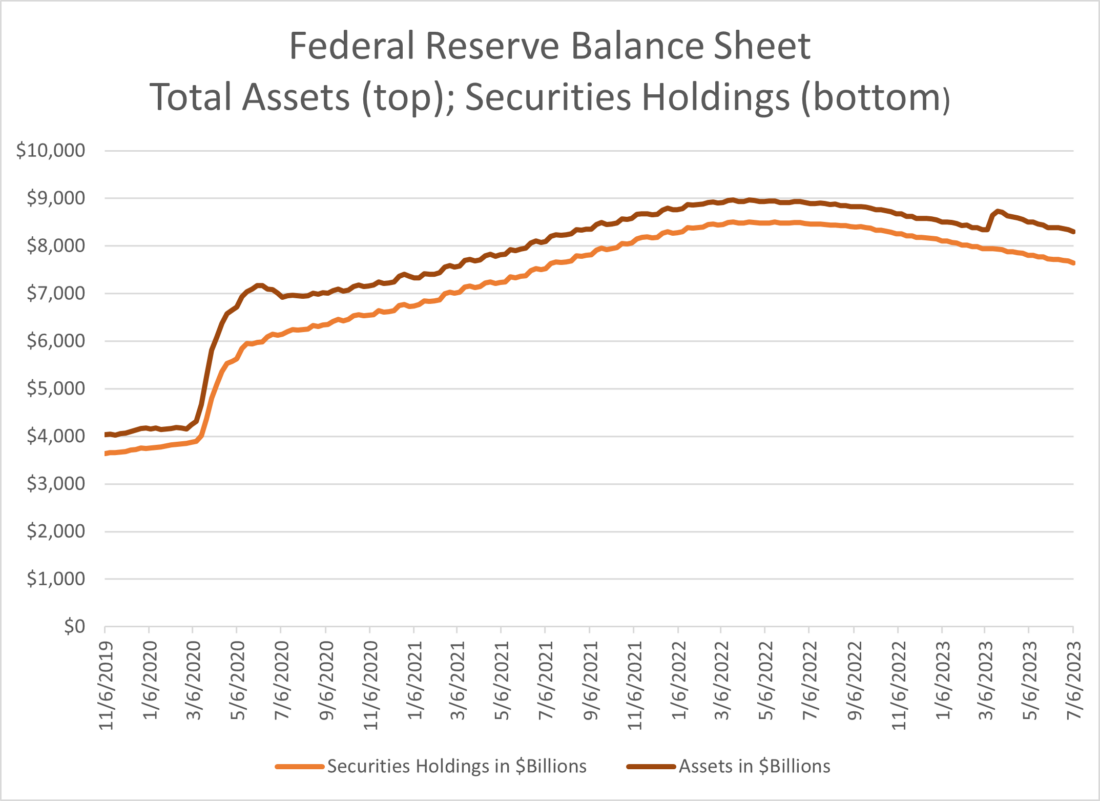
Source: Interactive Brokers, Federal Reserve H.4.1 Releases
It’s my contention that the equity market’s response to monetary policy changes is completely asymmetric. While rate hikes and restrictive policies have long and variable lags, accommodative policies have lags that are measured in weeks, not months. The market’s reaction to quantitative tightening is slow and barely perceptible. A jolt of liquidity is felt almost immediately and can bring positive momentum and FOMO along with it.
Looking ahead, 2Q earnings season begins this week. We enter it with elevated prices and expectations, some of which were the result of that temporary bout of monetary accommodation. We can see from the chart above that the accommodation is now behind us. That leaves us susceptible to disappointment. But we’ve avoided disappointment thus far. A key positive to the recent rally was the generally positive market reaction to 1Q earnings in April, which came out just as the monetary jolt was being incorporated into prices. Can that be repeated?
Also, the end of the student loan moratorium later this summer is a real risk factor. Much of the money that would have normally been used to pay back loans clearly flowed into stocks. Also, a recent report from the National Bureau of Economic Research showed that those with student loans are even more indebted now despite the post-Covid forbearance. The need to resume debt repayment could lead to outflows from the market just as we hit a seasonally difficult time for equities.
Thus, even though many strategists’ year-end targets are currently underwater, it’s premature to say that the bearish end of year calls are truly wrong. As far as the year goes, we’ve just finished half-time.
Join The Conversation
If you have a general question, it may already be covered in our FAQs. If you have an account-specific question or concern, please reach out to Client Services.
Leave a Reply
Disclosure: Interactive Brokers
The analysis in this material is provided for information only and is not and should not be construed as an offer to sell or the solicitation of an offer to buy any security. To the extent that this material discusses general market activity, industry or sector trends or other broad-based economic or political conditions, it should not be construed as research or investment advice. To the extent that it includes references to specific securities, commodities, currencies, or other instruments, those references do not constitute a recommendation by IBKR to buy, sell or hold such investments. This material does not and is not intended to take into account the particular financial conditions, investment objectives or requirements of individual customers. Before acting on this material, you should consider whether it is suitable for your particular circumstances and, as necessary, seek professional advice.
The views and opinions expressed herein are those of the author and do not necessarily reflect the views of Interactive Brokers, its affiliates, or its employees.
Disclosure: IBKR Tax Disclosure
Interactive Brokers does not provide tax advice, does not make representations regarding the particular tax consequences of any investments, and cannot assist clients with tax filings. Investors should consult with their tax professional about the tax implications of any investment.


Dry informative. Thanks. One reason for the stock market going up in the midst of aggressive rate hikes might be that the steep decline in 2022 had already priced in the worstcase scenario for stocks.