


Markets remain full of surprises. If I had told you in advance that we would receive worse than expected Consumer Price Index (CPI) and Producer Price Index (PPI) readings in rapid succession, both to levels that haven’t been seen in decades, would you have predicted that rates would pull back sharply?
Here is the breakdown. March CPI was up 8.5% yesterday, slightly exceeding the 8.4% consensus estimate. March Final Demand PPI was up an eye-popping 11.2%, well above an already high 10.6% consensus. On Monday, the 10-year US Treasury yield was 2.78% and the 2-year yield was 2.5%. Those rates are now 2.66% and 2.3% respectively.
Treasury rates are said to be primarily influenced by inflationary expectations and the path of future rate hikes. That is fundamentally correct, at least on a longer-term basis. Yet is hard to imagine that either of those inputs was diminished by the recent inflation reports. This is when we have to remember that in the short- to medium-term, there are many other factors that influence the price of all securities, and none greater than good old supply and demand.
Just before the end of the first quarter, we noted how the selloff in 2- and 10-year notes was reminiscent of the selloff in 10-year notes in the first quarter of 2021. Last year, we saw rates rise sharply in the first three months only to move lower thereafter. While the magnitude of the rise in 10-year yields was similar in each of those Q1 periods and generally linear, the rise in 2-year yields in Q1 2022 was essentially parabolic, as shown below:
US Treasury 2 Year Yields, 6 Month Chart, Daily Candles with 10 (magenta), 30 (green) and 50 (yellow) Day Moving Averages
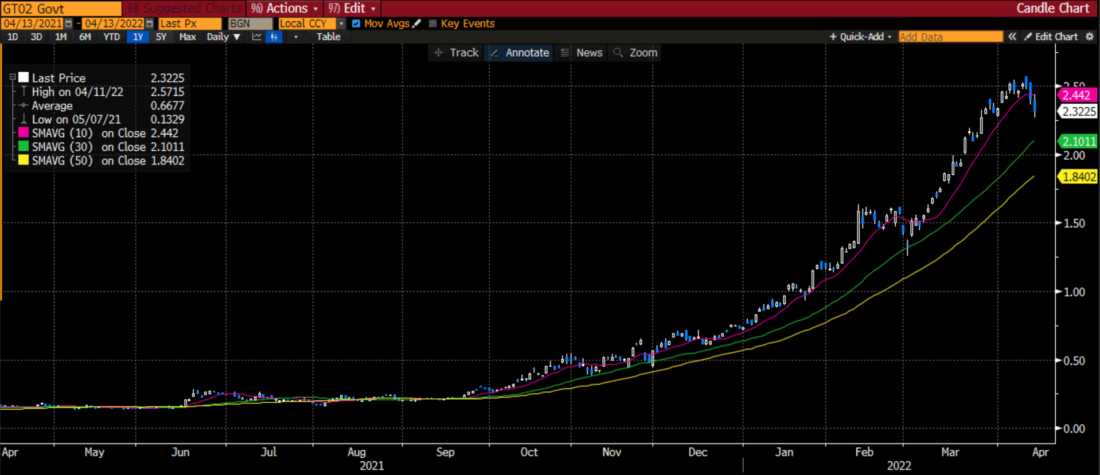
Source: Bloomberg
About a month ago, we noted, “Parabolic uptrends imply that some group is desperate for the commodity or security in question.” Bearing in mind that bond yields are the inverse of prices, it implies that someone was desperate to rid themselves of 2-year notes before the end of the quarterly reporting period. As we approached the quarter’s end, we asserted that falling bond prices and rising stock prices were caused by hasty asset allocation, writing:
“Just before the FOMC meeting two weeks ago, many institutional investors recognized that equities had become somewhat oversold. As the market bounced, those institutions realized that they were holding too much cash in a bouncing market ahead of a quarter-end reporting period. Asset allocators continued to sell fixed income, but the proceeds have been more aggressively deployed into equities in recent weeks.”
Stocks were quicker to reverse that trend than bonds. The S&P 500 Index (SPX) peaked on the last trading day that enabled end of quarter settlement (March 29th), while bond yields continued to drift higher until this week. Just as the March FOMC meeting proved a key trigger for equity investors to move into oversold stocks, it is entirely possible that this week’s inflation statistics triggered a delayed reaction to the oversold conditions in fixed income.
We described yesterday’s action in the equity market as “sell the rumor, buy the news.” As the day progressed and the rally faded, that turned into across-the-board selling. I believe that the late fade was caused by individuals who were selling stocks to pay impending tax liabilities, a phenomenon we discussed on Monday. Anyone who wanted cash in their account before the end of this week needed to finish their selling by yesterday. Today’s rebounding stock prices may be a sign that the tax selling has indeed abated.
Bottom line, we all want to be able to come up with fundamental explanations for the daily movements in asset prices, but sometimes those movements are being caused by psychological and supply/demand factors that make markets do some head-scratching things in the short- to medium-term.
Disclosure: Interactive Brokers
The analysis in this material is provided for information only and is not and should not be construed as an offer to sell or the solicitation of an offer to buy any security. To the extent that this material discusses general market activity, industry or sector trends or other broad-based economic or political conditions, it should not be construed as research or investment advice. To the extent that it includes references to specific securities, commodities, currencies, or other instruments, those references do not constitute a recommendation by IBKR to buy, sell or hold such investments. This material does not and is not intended to take into account the particular financial conditions, investment objectives or requirements of individual customers. Before acting on this material, you should consider whether it is suitable for your particular circumstances and, as necessary, seek professional advice.
The views and opinions expressed herein are those of the author and do not necessarily reflect the views of Interactive Brokers, its affiliates, or its employees.


