


2021 saw inflation arrive at the front door. With economic activity picking up again, stimuli in full force and global supply chains disrupted from the pandemic, investors are realising that our visitor might be here for a while. The question now is: how easy is it going to be to edge the unwelcome guest out the door, and what does it mean for asset allocation?
Central bank policy makers appear to have a higher tolerance for inflation than in previous cycles, even more so because of QE. They are taking their time as Covid has created a low base from which a jump in inflation is inevitable. Equally, economic support measures are being gradually withdrawn, which complicate the analysis. Supply chain disruption and shortages of everything, from HGV drivers to semiconductors, and an uneven pandemic exit between countries, point to a lengthy period of artificial and temporary inflation. However, there is a risk of being too complacent─ once inflation expectations become engrained they can be persistent. All this means, in the words of the Fed, it is “very difficult to say” how transitory the current surge in inflation is. While this is unhelpful in answering our question, it does suggest central banks will play a long game in a) unwinding QE b) raising rates and c) remain nervous about growth.
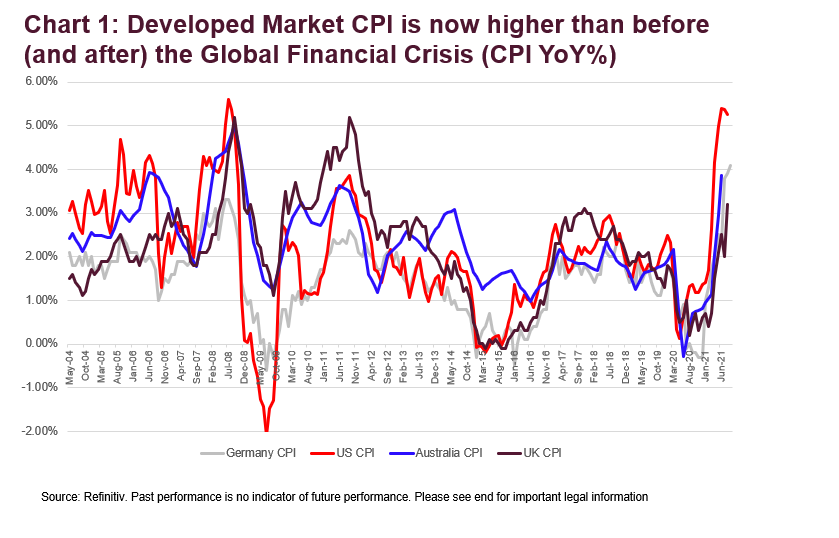
Coming back the question of how bad is inflation right now, global CPI is topping the high-water mark achieved pre and post the 2008 Global Financial Crisis. The only time it was consistently higher than now was in the 80s, when rates were in double digits in many economies. Pandemic policy responses have been highly correlated everywhere, so has been inflation outturn. Chart 1 illustrates this increase in correlation.
What are markets pricing in terms of the quantum and duration of inflation in this cycle?
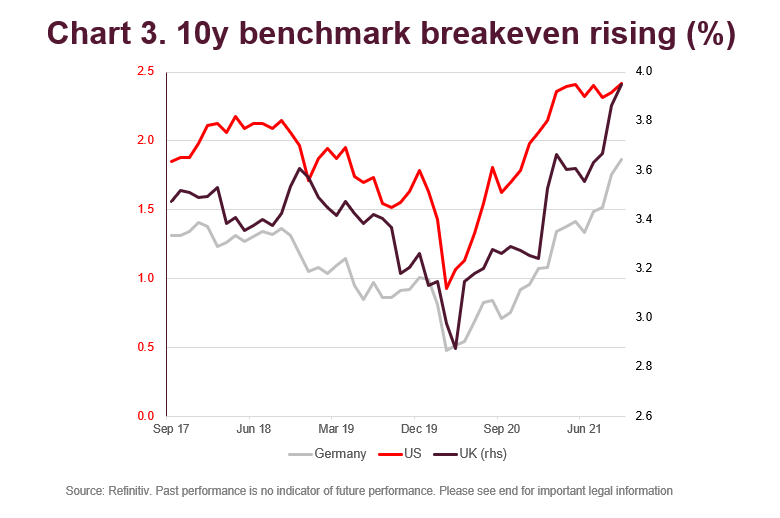
Breakeven inflation rates help us to answer this question. For instance, UK 10-year gilts nominal yields minus UK 10-year inflation-linked gilt yields gives us a 10-year ‘breakeven’ of 3.95% (RPI rather than CPI). This implies an expected average inflation rate over that time of 3.95% if bonds are priced at risk-neutral fair value (right hand side of chart 3). Breakevens across developed countries (DM) are already near, or pressing past central bank target levels (2% in most DMs) and historical averages, even before Covid measures are removed.’
It is worth adding a note of caution when looking at breakevens. There is a massive mismatch between the supply of inflation linked bonds and the demand for them. Governments, and a few utilities, are the only suppliers of inflation product and demand from pension funds and others tends to outstrip that supply, even in swap markets. Inflation-linked bonds are also not typically a liquid product, which may mean that high breakevens are just a reflection of a surge in demand caused by the growing dominance of inflation as an ‘investment theme’.
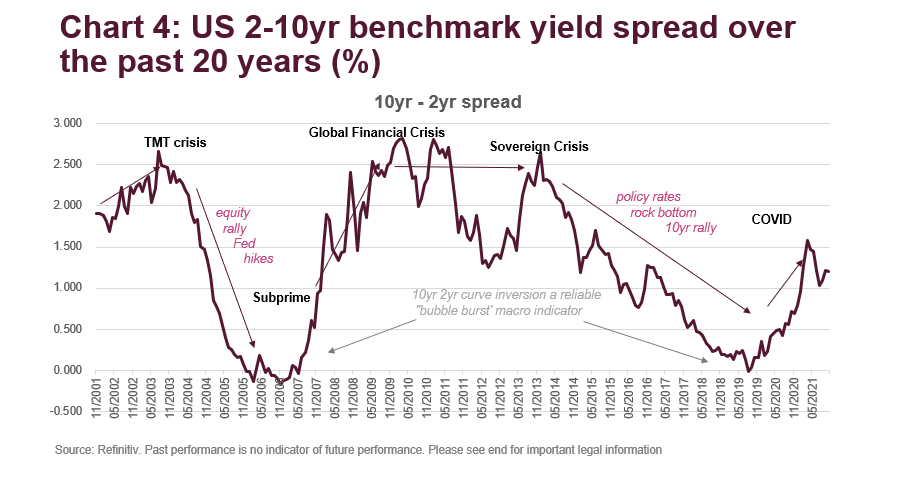
Therefore, what does this tell us about interest rates and bond yields? Looking at breakeven inflation and inflation outturns suggests that central banks should be hiking rates to stem inflation and yet they remain cautious for reasons outlined earlier. With billions of QE still to be unwound, huge uncertainties about inflation and economic growth prospects, ‘term premium’ should be higher than the near record lows set in 2019. These considerations have been a driving force for curve steepening across DM rates markets and seem likely to remain so, well into 2022. However, the global economic recovery is likely to be marred with setbacks and will see different geographies moving at different paces. historically, the US has been a first mover in recovery scenarios and the 2-10yr curve below illustrates how this steepening is already well underway as investors attempt to get ahead of economic fundamentals.
If inflation is here for a while, what does it mean for investors?
If central banks decide to unwind QE by selling their long-dated government bonds (rather than letting them mature) as a policy tool to fight inflation, then this sector would be a rather unappealing area to be positioned in. While a steepening curve will mean more attractive rates in the longer term, it is unappealing for fixed income investors today. So, what are investors doing in response?
1. Some funds have added ‘steepeners’ to hedge. A steepener is typically a short-position in a long-dated swap and a long-position in a short-dated swap.
2. Recreate option 1) through asset allocation. In its most simple form, this involves shortening the duration of the portfolio by allocating into short-dated assets or funds. For example:
- FTSE World Government Bond 0-1 Year sub-Index (i.e. roll-downs from the WGBI) or the FTSE Global Treasury Bill 0-1 Year Index Series
- FTSE Emerging Markets Government Bond 0-1 Year Index
3. Lighten duration heavy portfolios by shifting into fixed income portfolios without any duration at all such as floating rate notes or leveraged loans.
- FTSE US Treasury Floating-Rate Note Index
4. Increase allocations to TIPs, linkers or inflation-linked bonds funds.
- FTSE World Inflation-Linked Securities Index (WorldILSI)
- FTSE Emerging Markets Inflation-Linked Securities Index (EMILSI)
5. Commodities and risk assets tend to be less at risk from inflation, but equities and real estate have a had a long bull run.
6. Within fixed income, high yield credit tends to have shorter duration and high carry making it attractive on a hold-to-maturity view. Also, the FTSE US Preference Share and Hybrid Index has a short maturity to first call and high yields.
This process has been going on for over a year. Uncertainty has made short-term money market investments more attractive for investors. Unsurprisingly, total net assets in money market funds grew 21.7% over the year ending December 2020—the highest increase in the last 5 years1.
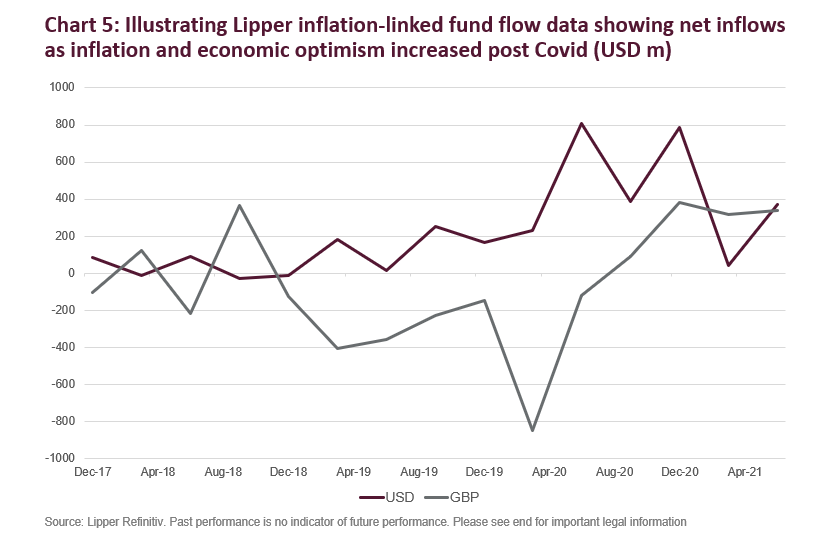
Equally, Chart 5 illustrates how flows into dedicated inflation funds picked up as the worst of lockdown passed and optimism about a recovery and inflation increased. Also, inflation-linked gilts saw outflows in 2019 on the back of uncertainty over RPI reform.
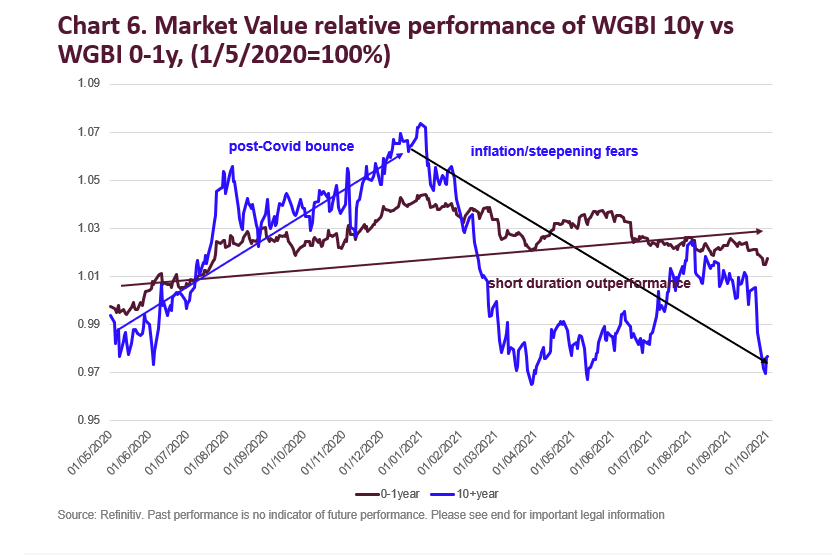
The new WGBI 0-1 year index is an alternative to a money market allocation and Chart 6 below illustrates how short duration indexes are outperforming higher durations ones. In this case, we have compared the WGBI 0-1 year with the WGBI 10+ as we can see how the 10yr+ started to underperform after the worst of the Covid lockdown.
[1] Morningstar Inc., data as of December 31, 2020, Worldwide OE, MM & ETF ex FoF ex Feeder, Exclude Obsolete Funds, Global Broad Category Group: Money Market.
—
Originally Posted on November 2, 2021 – Inflation, The Unwelcome House Guest: Here to Stay or Just Passing Through
Disclosure: FTSE Russell
Interactive Advisors, a division of Interactive Brokers Group, offers FTSE Russell Index Tracker portfolios on its online investing marketplace. Learn more about the Diversified Portfolios.
This material is not intended as investment advice. Interactive Advisors or portfolio managers on its marketplace may hold long or short positions in the companies mentioned through stocks, options or other securities.
© 2023 London Stock Exchange Group plc and its applicable group undertakings (the “LSE Group”). The LSE Group includes (1) FTSE International Limited (“FTSE”), (2) Frank Russell Company (“Russell”), (3) FTSE Global Debt Capital Markets Inc. and FTSE Global Debt Capital Markets Limited (together, “FTSE Canada”), (4) MTSNext Limited (“MTSNext”), (5) Mergent, Inc. (“Mergent”), (6) FTSE Fixed Income LLC (“FTSE FI”), (7) The Yield Book Inc (“YB”) and (8) Beyond Ratings S.A.S. (“BR”). All rights reserved.
FTSE Russell® is a trading name of FTSE, Russell, FTSE Canada, MTSNext, Mergent, FTSE FI, YB and BR. “FTSE®”, “Russell®”, “FTSE Russell®”, “MTS®”, “FTSE4Good®”, “ICB®”, “Mergent®”, “The Yield Book®”, “Beyond Ratings®“ and all other trademarks and service marks used herein (whether registered or unregistered) are trademarks and/or service marks owned or licensed by the applicable member of the LSE Group or their respective licensors and are owned, or used under licence, by FTSE, Russell, MTSNext, FTSE Canada, Mergent, FTSE FI, YB or BR. FTSE International Limited is authorised and regulated by the Financial Conduct Authority as a benchmark administrator.
All information is provided for information purposes only. All information and data contained in this publication is obtained by the LSE Group, from sources believed by it to be accurate and reliable. Because of the possibility of human and mechanical error as well as other factors, however, such information and data is provided “as is” without warranty of any kind. No member of the LSE Group nor their respective directors, officers, employees, partners or licensors make any claim, prediction, warranty or representation whatsoever, expressly or impliedly, either as to the accuracy, timeliness, completeness, merchantability of any information or of results to be obtained from the use of the FTSE Russell products, including but not limited to indexes, data and analytics or the fitness or suitability of the FTSE Russell products for any particular purpose to which they might be put. Any representation of historical data accessible through FTSE Russell products is provided for information purposes only and is not a reliable indicator of future performance.
No responsibility or liability can be accepted by any member of the LSE Group nor their respective directors, officers, employees, partners or licensors for (a) any loss or damage in whole or in part caused by, resulting from, or relating to any error (negligent or otherwise) or other circumstance involved in procuring, collecting, compiling, interpreting, analysing, editing, transcribing, transmitting, communicating or delivering any such information or data or from use of this document or links to this document or (b) any direct, indirect, special, consequential or incidental damages whatsoever, even if any member of the LSE Group is advised in advance of the possibility of such damages, resulting from the use of, or inability to use, such information.
No member of the LSE Group nor their respective directors, officers, employees, partners or licensors provide investment advice and nothing contained herein or accessible through FTSE Russell products, including statistical data and industry reports, should be taken as constituting financial or investment advice or a financial promotion.
Past performance is no guarantee of future results. Charts and graphs are provided for illustrative purposes only. Index returns shown may not represent the results of the actual trading of investable assets. Certain returns shown may reflect back-tested performance. All performance presented prior to the index inception date is back-tested performance. Back-tested performance is not actual performance, but is hypothetical. The back-test calculations are based on the same methodology that was in effect when the index was officially launched. However, back- tested data may reflect the application of the index methodology with the benefit of hindsight, and the historic calculations of an index may change from month to month based on revisions to the underlying economic data used in the calculation of the index.
This document may contain forward-looking assessments. These are based upon a number of assumptions concerning future conditions that ultimately may prove to be inaccurate. Such forward-looking assessments are subject to risks and uncertainties and may be affected by various factors that may cause actual results to differ materially. No member of the LSE Group nor their licensors assume any duty to and do not undertake to update forward-looking assessments.
No part of this information may be reproduced, stored in a retrieval system or transmitted in any form or by any means, electronic, mechanical, photocopying, recording or otherwise, without prior written permission of the applicable member of the LSE Group. Use and distribution of the LSE Group data requires a licence from FTSE, Russell, FTSE Canada, MTSNext, Mergent, FTSE FI, YB, BR and/or their respective licensors.
Disclosure: Interactive Brokers
Information posted on IBKR Campus that is provided by third-parties does NOT constitute a recommendation that you should contract for the services of that third party. Third-party participants who contribute to IBKR Campus are independent of Interactive Brokers and Interactive Brokers does not make any representations or warranties concerning the services offered, their past or future performance, or the accuracy of the information provided by the third party. Past performance is no guarantee of future results.
This material is from FTSE Russell and is being posted with its permission. The views expressed in this material are solely those of the author and/or FTSE Russell and Interactive Brokers is not endorsing or recommending any investment or trading discussed in the material. This material is not and should not be construed as an offer to buy or sell any security. It should not be construed as research or investment advice or a recommendation to buy, sell or hold any security or commodity. This material does not and is not intended to take into account the particular financial conditions, investment objectives or requirements of individual customers. Before acting on this material, you should consider whether it is suitable for your particular circumstances and, as necessary, seek professional advice.


