


I frown upon the use of intoxicants during the trading day, but I would like to propose a drinking game for bored, late summer traders. Have each one tune into a different financial network and take a drink when the phrase “Friday’s key non-farm payrolls report” or similar is mentioned. The winner (?) would be the trader who succumbs last. The game certainly won’t win over the cool frat boys, though, not least because it could end very quickly on a day like today.
But rather than engage in a ridiculous, potentially dangerous waste of time, I’d much prefer if traders focused on the upcoming number itself and the markets’ potential reactions to its release at 8:30 AM EDT on Friday. Unfortunately, neither is easy to determine in advance.
Economists haven’t had an easy time estimating the monthly changes in nonfarm payrolls (NFP) since the Covid crisis was at its worst. The chart below shows the actual change in NFP (white) plotted against the median estimate of economists for that month’s release (blue). We see that economists generally got the direction correct – with the obvious exception of April and May 2021 – but seemed to have less volatility in their estimates than the NFP release itself.
Monthly Changes in Nonfarm Payrolls (white) vs. Median Analyst Estimates (blue)
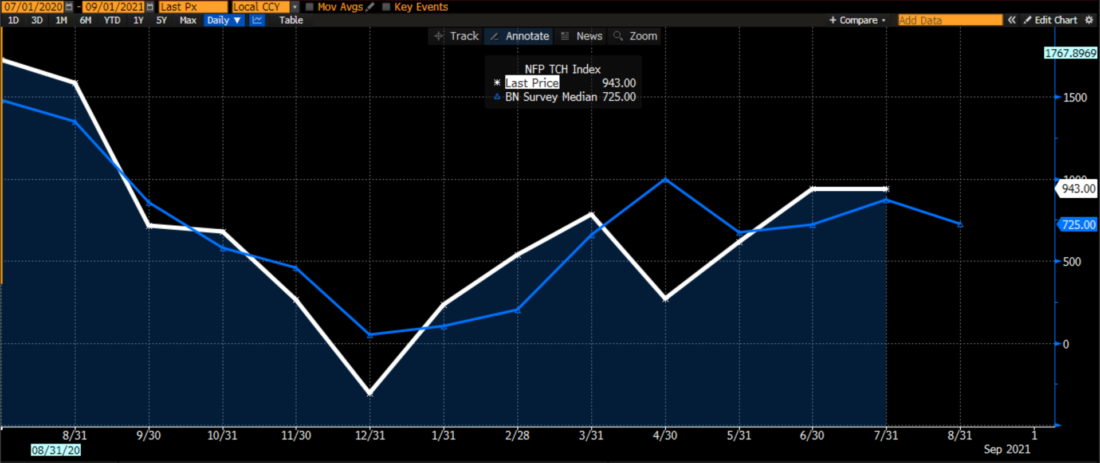
Source: Bureau of Labor Statistics, Bloomberg
Many analysts like to use the ADP Payrolls report as a guide. While the NFP report typically arrives on the first Friday of a month, the ADP report typically arrives on the Wednesday prior. Economists have had a better track record estimating this number for the past few months, despite a rocky start and a recent hiccup:
Monthly Changes in ADP Payrolls (white) vs. Median Analyst Estimates (blue)

Source: Bloomberg
It would be logical to think ADP payrolls offer an excellent guide to the NFP numbers that follow. Unfortunately, the data shows otherwise. I calculated the month-over-month percentage change in both the ADP and NFP releases to see how well they correlate. The short answer, as is evident in the graph below, is “not so great”

Source: Bloomberg, Interactive Brokers
I believe that most of the differences stem from the different types of data that are collected. ADP describes their data this way:
The ADP® National Employment ReportTM is a monthly measure of the change in total U.S. nonfarm private employment derived from actual, anonymous payroll data of client companies served by ADP®, a leading provider of human capital management solutions. The report, which measures nearly 26 million U.S. workers, is produced by the ADP Research Institute®, a specialized group within the company that provides insights around employment trends and workforce strategy, in collaboration with Moody’s Analytics, Inc.
The key here is that ADP data is derived from ADP customers (IBKR is one). These tend to be larger employers who find it beneficial to outsource their payroll and related functions to a large outside vendor. Meanwhile, the BLS deliberately attempts to reach small businesses as well:
“about 40 percent of the establishment survey sample is comprised of business establishments with fewer than 20 employees. The establishment survey sample is designed to maximize the reliability of the statewide total nonfarm employment estimate; firms from all states, size classes, and industries are appropriately sampled to achieve that goal.”
It would appear that the outperformance of the ADP data last fall could be related to the idea that larger companies rebounded more quickly than smaller ones to Covid-related lockdowns. On the other hand, earlier this year ADP seemed to lag NFP by a month. A glance at the graph shows the differentiation, and a quick statistical analysis shows it more clearly. I used the RSQ and CORREL functions in Excel to look for the correlation between the monthly changes in each data series to see if this showed a meaningful relationship. Here are the results:
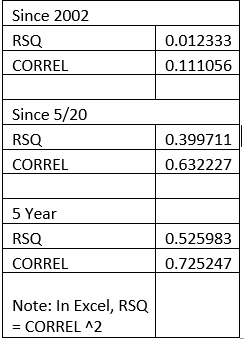
Source: Bloomberg, Interactive Brokers
Over the past 20 years, the correlation stinks. It is essentially random. Since May 2020 it shows a better result, though it is indeed a limited data series. The best results appear in the 5 year numbers, with a decent but unreliable correlation. It may be reasonable to assume that ADP’s data collection and methodology have improved over the life of the report, which would improve the tracking between the two reports. My conclusion is that the ADP report is a useful, but hardly foolproof guide to the ensuing BLS Nonfarm Payrolls report. Perhaps the markets already realize that, because they barely reacted to a major miss this morning (374K reported vs 625K expected). Or, more significantly, it could be that market nihilism means that investors simply don’t care or that the Goldilocks effect will allow investors to create a market-friendly narrative out of statistics no matter what. That appeared to be the case for previous releases, something we wrote about in the aftermath of the May 2021 numbers. It will be interesting to see how markets react to the Friday’s numbers, considering that September has been a historically rocky time for investors. Unfortunately, today’s ADP report fails to provide clarity toward that outcome.
Disclosure: Interactive Brokers
The analysis in this material is provided for information only and is not and should not be construed as an offer to sell or the solicitation of an offer to buy any security. To the extent that this material discusses general market activity, industry or sector trends or other broad-based economic or political conditions, it should not be construed as research or investment advice. To the extent that it includes references to specific securities, commodities, currencies, or other instruments, those references do not constitute a recommendation by IBKR to buy, sell or hold such investments. This material does not and is not intended to take into account the particular financial conditions, investment objectives or requirements of individual customers. Before acting on this material, you should consider whether it is suitable for your particular circumstances and, as necessary, seek professional advice.
The views and opinions expressed herein are those of the author and do not necessarily reflect the views of Interactive Brokers, its affiliates, or its employees.


