


By: Matthew J Bartolini, CFA & Martin D Dunn
- Tax-loss harvesting is the act of selling a security in a taxable account at a loss and using the loss to offset realized taxable gains to help reduce taxes.
- The rise in interest rates has put downward pressure on bond prices across many sectors, creating tax-loss harvesting opportunities for fixed income positions in a year when most equity exposures — with the exception of China-region equities — have rallied.
- After harvesting losses, consider low-cost ETFs whether you are investing sale proceeds in a swap or more permanent portfolio replacement.
Interest rates rose sharply at the end of September as the US 10-year Treasury yield spiked 31 basis points from 1.30% to 1.61% today.1 As a result, investors likely felt a twinge of pain from their fixed income holdings.
While the increase in rates has put downward pressure on bond prices across many sectors, all is not lost.
The silver lining? This weakness has created tax-loss harvesting opportunities for fixed income positions in a year when most equity exposures have rallied — except for Chinese equities.2
Our Process to Find Tax-Loss Harvesting Opportunities
Tax-loss harvesting is the act of selling a security in a taxable account at a loss and using the loss to offset realized taxable gains to help reduce taxes.
Before analyzing where the opportunities for tax-loss harvesting reside, it is important to distinguish between a security’s total return and price return. Total return considers all income received from a security throughout the investor’s holding period (dividends, interest, etc.). In the case of tax-loss harvesting, price return is what matters. An investor’s capital gains liability (or loss) is based on the purchase price and the sale price, without any regard for dividend or interest payments received.
For this study, we calculated the year-to-date price change for every US-listed exchange traded fund (ETF) through October 11th (approx. 2,800 funds). We then set a price loss threshold of 2% to flag funds that could potentially be tax-loss harvesting candidates. Once we identified all the funds that met this threshold, we segmented them based on their Morningstar categories and aggregated the data in order to identify trends.
Most Tax-Loss Harvesting Opportunities Are in Bonds
Because the income received is such a large component of a bond’s return, this asset class often can be overlooked when tax-loss harvesting. Investors often view a bond exposure as having generated positive total return due to the income received, when the price return has a loss.
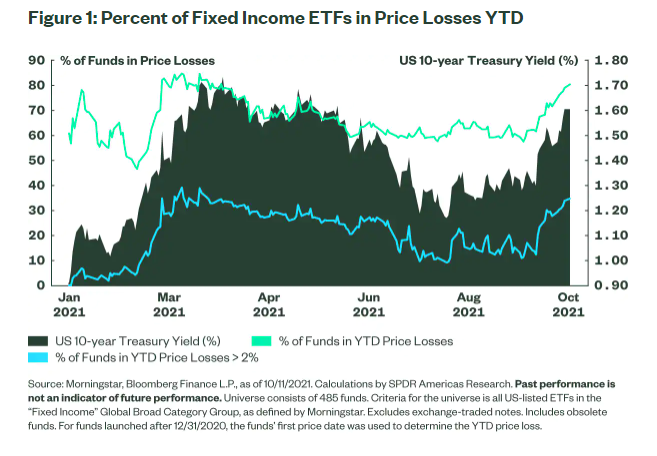
The sharp rise in rates has pushed approximately four out of every five fixed income ETFs into year-to-date price losses. And approximately one in every three funds currently has a price loss of more than 2%3 (see Figure 1). For bond investors, this presents a plethora of positions that could be harvested this autumn.
Figure 1: Percent of Fixed Income ETFs in Price Losses YTD
Click here to read the full article
Footnotes
1Bloomberg Finance L.P. as of October 8, 2021.
2Bloomberg Finance L.P. as of October 8, 2021. The year-to-date price change of the S&P 500, MSCI EAFE, and MSCI ACWI is 16.11%, 10.72% and 5.94%, respectively. The year-to-date price change of the MSCI China is -14.70%. Past performance is not an indicator of future performance.
3Morningstar, Bloomberg Finance L.P., as of 10/11/2021. Calculations by SPDR Americas
Glossary
S&P 500 Index A market-capitalization-weighted index of 500 leading publicly traded companies in the U.S. It is not an exact list of the top 500 U.S. companies by market cap because there are other criteria to be included in the index.
MSCI ACWI Index A stock index designed to track broad global equity-market performance, All Country World Index (ACWI). Maintained by Morgan Stanley Capital International (MSCI), the index is comprised of the stocks of about 3,000 companies from 23 developed countries and 26 emerging markets.
MSCI AEFE Index Designed to represent the performance of large and mid-cap securities across 21 developed markets, including countries in Europe, Australasia and the Far East, excluding the U.S. and Canada. Europe, Australasia (the region made up of Australia and New Zealand), and the Far East.
—
Originally Posted on October 25, 2021 – Q4 2021 Tax-Loss Harvesting: Fixed Income and China ETFs
Disclosures
Important Risk Information
The views expressed in this material are the views of Matthew Bartolini and Martin Dunn through the period ended October 20, 2021 and are subject to change based on market and other conditions. This document contains certain statements that may be deemed forward-looking statements. Please note that any such statements are not guarantees of any future performance and actual results or developments may differ materially from those projected.
This communication is not intended to be an investment recommendation or investment advice and should not be relied upon as such.
Past performance is not a reliable indicator of future performance.
The trademarks and service marks referenced herein are the property of their respective owners. Third party data providers make no warranties or representations of any kind relating to the accuracy, completeness or timeliness of the data and have no liability for damages of any kind relating to the use of such data.
The whole or any part of this work may not be reproduced, copied or transmitted or any of its contents disclosed to third parties without SSGA’s express written consent.
All information is from SSGA unless otherwise noted and has been obtained from sources believed to be reliable, but its accuracy is not guaranteed. There is no representation or warranty as to the current accuracy, reliability or completeness of, nor liability for, decisions based on such information and it should not be relied on as such.
The information provided does not constitute investment advice and it should not be relied on as such. It should not be considered a solicitation to buy or an offer to sell a security. It does not take into account any investor’s particular investment objectives, strategies, tax status or investment horizon. You should consult your tax and financial advisor.
Investing involves risk included the risk of loss of principal.
Diversification does not ensure a profit or guarantee against loss.
Equity securities may fluctuate in value in response to the activities of individual companies and general market and economic conditions.
Non-diversified funds that focus on a relatively small number of securities tend to be more volatile than diversified funds and the market as a whole.
Passively managed funds hold a range of securities that, in the aggregate, approximates the full Index in terms of key risk factors and other characteristics. This may cause the fund to experience tracking errors relative to performance of the index.
While the shares of ETFs are tradable on secondary markets, they may not readily trade in all market conditions and may trade at significant discounts in periods of market stress.
Bonds generally present less short-term risk and volatility than stocks, but contain interest rate risk (as interest rates rise, bond prices usually fall); issuer default risk; issuer credit risk; liquidity risk; and inflation risk. These effects are usually pronounced for longer-term securities. Any fixed income security sold or redeemed prior to maturity may be subject to a substantial gain or loss.
Investments in mortgage securities are subject to prepayment risk, which can limit the potential for gain during a declining interest rate environment and increase the potential for loss in a rising interest rate environment. The mortgage industry can also be significantly affected by regulatory changes, interest rate movements, home mortgage demand, refinancing activity, and residential delinquency trends.
Investing in high yield fixed income securities, otherwise known as “junk bonds”, is considered speculative and involves greater risk of loss of principal and interest than investing in investment grade fixed income securities. These Lower-quality debt securities involve greater risk of default or price changes due to potential changes in the credit quality of the issuer.
The funds presented herein have different investment objectives, costs and expenses. Each fund is managed by a different investment firm, and the performance of each fund will necessarily depend on the ability of their respective managers to select portfolio investments. These differences, among others, may result in significant disparity in the funds’ portfolio assets and performance. For further information on the funds, please review their respective prospectuses.
Disclosure: State Street Global Advisors
Do not reproduce or reprint without the written permission of SSGA.
All information has been obtained from sources believed to be reliable, but its accuracy is not guaranteed. There is no representation or warranty as to the current accuracy, reliability or completeness of, nor liability for, decisions based on such information and it should not be relied on as such.
State Street Global Advisors and its affiliates (“SSGA”) have not taken into consideration the circumstances of any particular investor in producing this material and are not making an investment recommendation or acting in fiduciary capacity in connection with the provision of the information contained herein.
ETFs trade like stocks, are subject to investment risk, fluctuate in market value and may trade at prices above or below the ETF’s net asset value. Brokerage commissions and ETF expenses will reduce returns.
Bonds generally present less short-term risk and volatility than stocks, but contain interest rate risk (as interest rates raise, bond prices usually fall); issuer default risk; issuer credit risk; liquidity risk; and inflation risk. These effects are usually pronounced for longer-term securities. Any fixed income security sold or redeemed prior to maturity may be subject to a substantial gain or loss.
Investing involves risk including the risk of loss of principal.
The whole or any part of this work may not be reproduced, copied or transmitted or any of its contents disclosed to third parties without SSGA’s express written consent.
Investing in high yield fixed income securities, otherwise known as “junk bonds”, is considered speculative and involves greater risk of loss of principal and interest than investing in investment grade fixed income securities. These Lower-quality debt securities involve greater risk of default or price changes due to potential changes in the credit quality of the issuer.
COPYRIGHT AND OTHER RIGHTS
Other third party content is the intellectual property of the respective third party and all rights are reserved to them. All rights reserved. No organization or individual is permitted to reproduce, distribute or otherwise use the statistics and information in this report without the written agreement of the copyright owners.
Definition:
Arbitrage: the simultaneous buying and selling of securities, currency, or commodities in different markets or in derivative forms in order to take advantage of differing prices for the same asset.
Fund Objectives:
SPY: The investment seeks to provide investment results that, before expenses, correspond generally to the price and yield performance of the S&P 500® Index. The Trust seeks to achieve its investment objective by holding a portfolio of the common stocks that are included in the index (the “Portfolio”), with the weight of each stock in the Portfolio substantially corresponding to the weight of such stock in the index.
VOO: The investment seeks to track the performance of a benchmark index that measures the investment return of large-capitalization stocks. The fund employs an indexing investment approach designed to track the performance of the Standard & Poor’s 500 Index, a widely recognized benchmark of U.S. stock market performance that is dominated by the stocks of large U.S. companies. The advisor attempts to replicate the target index by investing all, or substantially all, of its assets in the stocks that make up the index, holding each stock in approximately the same proportion as its weighting in the index.
IVV: The investment seeks to track the investment results of the S&P 500 (the “underlying index”), which measures the performance of the large-capitalization sector of the U.S. equity market. The fund generally invests at least 90% of its assets in securities of the underlying index and in depositary receipts representing securities of the underlying index. It may invest the remainder of its assets in certain futures, options and swap contracts, cash and cash equivalents, as well as in securities not included in the underlying index, but which the advisor believes will help the fund track the underlying index.
The funds presented herein have different investment objectives, costs and expenses. Each fund is managed by a different investment firm, and the performance of each fund will necessarily depend on the ability of their respective managers to select portfolio investments. These differences, among others, may result in significant disparity in the funds’ portfolio assets and performance. For further information on the funds, please review their respective prospectuses.
Entity Disclosures:
The trademarks and service marks referenced herein are the property of their respective owners. Third party data providers make no warranties or representations of any kind relating to the accuracy, completeness or timeliness of the data and have no liability for damages of any kind relating to the use of such data.
SSGA Funds Management, Inc. serves as the investment advisor to the SPDR ETFs that are registered with the United States Securities and Exchange Commission under the Investment Company Act of 1940. SSGA Funds Management, Inc. is an affiliate of State Street Global Advisors Limited.
Intellectual Property Disclosures:
Standard & Poor’s®, S&P® and SPDR® are registered trademarks of Standard & Poor’s® Financial Services LLC (S&P); Dow Jones is a registered trademark of Dow Jones Trademark Holdings LLC (Dow Jones); and these trademarks have been licensed for use by S&P Dow Jones Indices LLC (SPDJI) and sublicensed for certain purposes by State Street Corporation. State Street Corporation’s financial products are not sponsored, endorsed, sold or promoted by SPDJI, Dow Jones, S&P, their respective affiliates and third party licensors and none of such parties make any representation regarding the advisability of investing in such product(s) nor do they have any liability in relation thereto, including for any errors, omissions, or interruptions of any index.
BLOOMBERG®, a trademark and service mark of Bloomberg Finance, L.P. and its affiliates, and BARCLAYS®, a trademark and service mark of Barclays Bank Plc., have each been licensed for use in connection with the listing and trading of the SPDR Bloomberg Barclays ETFs.
Distributor: State Street Global Advisors Funds Distributors, LLC, member FINRA, SIPC, an indirect wholly owned subsidiary of State Street Corporation. References to State Street may include State Street Corporation and its affiliates. Certain State Street affiliates provide services and receive fees from the SPDR ETFs.
ALPS Distributors, Inc., member FINRA, is distributor for SPDR® S&P 500®, SPDR® S&P MidCap 400® and SPDR® Dow Jones Industrial Average, all unit investment trusts. ALPS Distributors, Inc. is not affiliated with State Street Global Advisors Funds Distributors, LLC.
Before investing, consider the funds’ investment objectives, risks, charges, and expenses. For SPDR funds, you may obtain a prospectus or summary prospectus containing this and other information by calling 1‐866‐787‐2257 or visiting www.spdrs.com. Please read the prospectus carefully before investing.
Disclosure: Interactive Brokers
Information posted on IBKR Campus that is provided by third-parties does NOT constitute a recommendation that you should contract for the services of that third party. Third-party participants who contribute to IBKR Campus are independent of Interactive Brokers and Interactive Brokers does not make any representations or warranties concerning the services offered, their past or future performance, or the accuracy of the information provided by the third party. Past performance is no guarantee of future results.
This material is from State Street Global Advisors and is being posted with its permission. The views expressed in this material are solely those of the author and/or State Street Global Advisors and Interactive Brokers is not endorsing or recommending any investment or trading discussed in the material. This material is not and should not be construed as an offer to buy or sell any security. It should not be construed as research or investment advice or a recommendation to buy, sell or hold any security or commodity. This material does not and is not intended to take into account the particular financial conditions, investment objectives or requirements of individual customers. Before acting on this material, you should consider whether it is suitable for your particular circumstances and, as necessary, seek professional advice.
Disclosure: Tax-Related Items (Circular 230 Notice)
The information in this material is provided for informational purposes only and does not constitute tax advice and cannot be used by the recipient or any other taxpayer to avoid penalties under any federal, state, local or other tax statutes or regulations, or to resolve any tax issue.


